Uncommon Descent Serving The Intelligent Design Community

How Can Anyone Be Serious about AGW?

Categories
Intelligent Design
Share
Facebook
Twitter/X
LinkedIn
Flipboard
Print
Email

Here’s a graph from the IPCC. I just happened upon it.
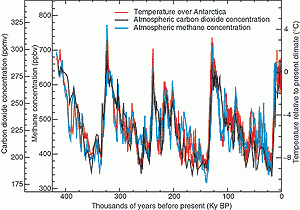
IPCC Report Fig 2.22  Historic Record of Temp, CO2 and Methane
IPCC Report Fig 2.22 Historic Record of Temp, CO2 and Methane from Antartic Icecores.

Notice that, historically, global temperatures were, cyclically, about 4 degrees warmer than now. Just look at the repeated cycle! It’s been getting warmer for the last 15,000 years plus.

AGW is just a farce. And the IPCC itself makes this point.

Comments
bornagain77 No, I don't find it peculiar, because many ID proponents on this blog assume anyone contradicting them *must* be an evolutionist and an atheist ... regardless of the truth of the matter and despite correction. Speaks volumes.CLAVDIVS
September 25, 2016
September
09
Sep
25
25
2016
05:48 AM
5
05
48
AM
PDT
CLAVDIVS "I’m not an evolutionist or an atheist." Don't you find it peculiar that you have to constantly keep reminding people on UD that you are not an atheist over and over again? Perhaps its time for you to finally concede that you really are a duck? https://waterman99.files.wordpress.com/2013/07/image10.pngbornagain77
September 25, 2016
September
09
Sep
25
25
2016
05:45 AM
5
05
45
AM
PDT
Vy – huh? The “shaky foundations” are this post. have you looked at any other data?
Sorry about that. Here's the corrected link.Vy
September 25, 2016
September
09
Sep
25
25
2016
05:27 AM
5
05
27
AM
PDT
South America Excerpt: Ironically, the site with perhaps the best claim to a pre-12,000 BP date in the Americas is among the farthest south, Monte Verde, in south central Chile. Here Tom Dillehay and his crew have excavated a camp site that has been radiocarbon-dated to about 13,000 years ago, and below the levels of that age are layers of tools and debris that may be much older, perhaps up to 33,000 years old.(26),,, Dozens and dozens of hulking blocks lay scattered in all directions, tossed like matchsticks, Posnansky argued, in the terrible natural disaster that had overtaken Tiahuanaco during the eleventh millennium BC: This catastrophe was caused by seismic movements which resulted in an overflow of the waters of Lake Titicaca and in volcanic eruptions… In addition, fragments of human and animal skeletons had been found lying in chaotic disorder among wrought stones, utensils, tools and an endless variety of other things. All of this has been moved, broken and accumulated in a confused heap. Anyone who would dig a trench here two metres deep could not deny that the destructive force of water, in combination with brusque movements of the earth, must have accumulated those different kinds of bones, mixing them with pottery, jewels, tools and utensils…(152) http://humanpast.net/environment/environment11k.htm etc.. etc..
As to South America in particular, Charles Darwin himself predicted that a geological formation that he had looked at in South America must have been formed 'gradually', yet the formation is now known to have been formed by a catastrophic mega-flood:
Where Darwin Went Wrong - geology video http://www.youtube.com/watch?v=3darzVqzV2o
Moreover, the dating of the first 'advanced' human civilization is approx. 12,000 years before the present in South-eastern Turkey:
Stone Age Temple May Be Birthplace of Civilization Excerpt: The elaborate temple at Gobelki Tepe in southeastern Turkey, near the Syrian border, is staggeringly ancient: 11,500 years old, from a time just before humans learned to farm grains and domesticate animals. According to the German archaeologist in charge of excavations at the site, it might be the birthplace of agriculture, of organized religion — of civilization itself. http://www.freerepublic.com/tag/gobeklitepe/index
Southeastern Turkey just so happens to be close to where Noah's Ark is said to have come to rest in the Bible. Of related interest, there is far more water deep beneath the earth than was expected. Enough water to cover the mountains:
Study: Deep beneath the earth, more water than in all the oceans combined – June 16, 2014 Excerpt: And its a good thing, too, Jacobsen told New Scientist: “We should be grateful for this deep reservoir. If it wasn’t there, it would be on the surface of the Earth, and mountain tops would be the only land poking out.” https://www.washingtonpost.com/news/morning-mix/wp/2014/06/16/study-deep-beneath-north-america-theres-more-water-than-in-all-the-oceans-combined/
This deep reservoir of water underneath the earth, a reservoir that could potentially cover the mountains, matches what is said in the Bible, i.e. 'the fountains of the great deep burst open':
Genesis 7:11 In the six hundredth year of Noah’s life, in the second month, on the seventeenth day of the month, on the same day all the fountains of the great deep burst open, and the floodgates of the sky were opened.
Music:
Jars Of Clay - Flood (Original Version) https://www.youtube.com/watch?v=wNGLU_VsePg
bornagain77
September 25, 2016
September
09
Sep
25
25
2016
05:26 AM
5
05
26
AM
PDT
Vy @ 30
CLAVDIVS: Seriously? You’re telling me when you look at the chart in the OP the peaks and troughs look random to you?
Vy: The universe and life is designed and yet evodelusionists and their theistic brethren say it’s randomness. Are you sure you’re in a place to be asking such a question?
I'm not an evolutionist or an atheist. Now will you answer the question?
CLAVDIVS: Vy, that paper is talking about deposition of rocks in the ocean, not ice cores. Did you even read it?
Vy: Are the inferences from the Milankovitch cycles with respect to climate exclusive to ice cores?
Irrelevant. The paper explains why its more difficult to detect Milankovich cycles in sedimentary layers due to the specific physics of underwater deposition. It has absolutely nothing to do with Milankovitch cycles in ice cores.CLAVDIVS
September 25, 2016
September
09
Sep
25
25
2016
05:25 AM
5
05
25
AM
PDT
As to catastrophic climate change, scientific evidence for catastrophic megafloods, across the globe, approx. 13 to 14 thousand years before the present has now become compelling.
Humanpast.net Excerpt: Worldwide, we know that the period of 14,000 to 13,000 years ago, which coincides with the peak of abundant monsoonal rains over India, was marked by violent oceanic flooding – in fact, the first of the three great episodes of global superfloods that dominated the meltdown of the Ice Age. The flooding was fed not merely by rain but by the cataclysmic synchronous collapse of large ice-masses on several different continents and by gigantic inundations of meltwater pouring down river systems into the oceans. (124) What happened, at around 13,000 years ago, was that the long period of uninterrupted warming that the world had just passed through (and that had greatly intensified, according to some studies, between 15,000 years ago and 13,000 years ago) was instantly brought to a halt – all at once, everywhere – by a global cold event known to palaeo climatologists as the ‘Younger Dryas’ or ‘Dryas III’. In many ways mysterious and unexplained, this was an almost unbelievably fast climatic reversion – from conditions that are calculated to have been warmer and wetter than today’s 13,000 years ago, to conditions that were colder and drier than those at the Last Glacial Maximum, not much more than a thousand years later. From that moment, around 12,800 years ago, it was as though an enchantment of ice had gripped the earth. In many areas that had been approaching terminal meltdown full glacial conditions were restored with breathtaking rapidity and all the gains that had been made since the LGM were simply stripped away…(124) A great, sudden extinction took place on the planet, perhaps as recently as 11,500 years ago (usually attributed to the end of that last ice age), in which hundreds of mammal and plant species disappeared from the face of the earth, driven into deep caverns and charred muck piles the world over. Modern science, with all its powers and prejudices, has been unable to adequately explain this event. (83) http://humanpast.net/environment/environment11k.htm
Evidence of catastrophic megaflooding is present on every continent:
Catastrophic Flooding from Ancient Lake May Have Triggered Cold Period Excerpt: Imagine a lake three times the size of the present-day Lake Ontario breaking through a dam and flooding down the Hudson River Valley past New York City and into the North Atlantic. The results would be catastrophic if it happened today, but it did happen some 13,400 years ago during the retreat of glaciers over North America http://www.whoi.edu/page.do?pid=9779&tid=282&cid=2078&ct=162 Mega-flood triggered cooling 13,000 years ago: scientists – March 2010 Excerpt: Bateman and his team confirmed the path of the floodwaters from Lake Agassiz that covered part of what is now Canada and the northern United States. The lake had formed in front of the ice-sheet that once covered a large part of North America. Scientists had previously guessed that a giant flood unleashed from the lake probably caused the Younger Dryas cooling but couldn’t confirm the route of the floodwaters. Bateman found that the waters flowed down the Mackenzie River, Canada’s longest, rather than the Saint Lawrence Seaway that had previously seemed the most likely route. Studying sediments from cliff sections along the river delta, he said the evidence spanned a large area at many altitudes. This could only be explained by a mega-flood from Lake Agassiz. Dating of the sediments helped the team pin down the date of the flooding, showing that it occurred right at the start of the Younger Dryas. http://www.reuters.com/article/2010/03/31/us-climate-cooling-flood-idUSTRE62U44D20100331 Lake Bonneville and the Bonneville Flood Excerpt: Ice Age Lake Bonneville, which existed around 14,500 years ago, covered more than 20,000 square miles in Utah and parts of Idaho and Nevada. For hundreds of years, the water level of Lake Bonneville maintained a fairly constant level. The water level dropped almost 400 feet when part of Red Rock Pass, which was holding back the water, eroded. The floodwaters flowed down the Snake River and joined the Columbia River near the Tri-Cities. For a short period of time, the resulting floodwaters from Lake Bonneville increased the size of the Snake River and the Columbia River by more than 20 times their normal flow. After the flood occurred, the water levels of the Great Salt Lake eventually subsided close to what they are now. Lake Bonneville drained only once, with catastrophic results. http://vulcan.wr.usgs.gov/Glossary/Glaciers/IceSheets/description_lake_bonneville.html Siberia Ancient Earth Flood Created Martian-Like Landscape, Researchers Find - July 2010 Excerpt: This summer, he will continue the work he started at Mason by traveling to Siberia to study a series of mega floods that happened between 45,000 and 13,000 years ago. http://news.gmu.edu/articles/3416 Ancient mega floods in the monsoon tropics of Australia coincide with climatic instability (approx. 15, 000 years ago) http://www.ansto.gov.au/AboutANSTO/MediaCentre/News/ACS013099#sthash.Wbwf2HUM.dpuf
bornagain77
September 25, 2016
September
09
Sep
25
25
2016
05:25 AM
5
05
25
AM
PDT
PaV @ 42 The original article is here. Yes, they removed the reference to climate change. And no, neither the original nor the rewritten article claim the hurricane was caused by global warming.CLAVDIVS
September 25, 2016
September
09
Sep
25
25
2016
05:16 AM
5
05
16
AM
PDT
LOL!
PaV: The comment I made was based on the graph in the OP. Would you like to contradict my statement using that graph?
You are not dealing with the evidence contrary to your position. You are just trying to sweep it under the rug. Reminds me of a letter Galileo wrote to Kepler:
"My dear Kepler, I wish that we might laugh at the remarkable stupidity of the common herd. What do you have to say about the principal philosophers of this academy who are filled with the stubbornness of an asp and do not want to look at either the planets, the moon or the telescope, even though I have freely and deliberately offered them the opportunity a thousand times? Truly, just as the asp stops its ears, so do these philosophers shut their eyes to the light of truth." Galileo Galilei
CLAVDIVS
September 25, 2016
September
09
Sep
25
25
2016
05:12 AM
5
05
12
AM
PDT
Vy - huh? The "shaky foundations" are this post. have you looked at any other data? PaV - I think reality is a better tool to contradict what you wrote. The graph simply doesn't have the resolution for you to see clearly what happened.Bob O'H
September 25, 2016
September
09
Sep
25
25
2016
04:46 AM
4
04
46
AM
PDT
wd400: John claims that Fox News deleted mention of 'climate change' in the article. Do you have access to the article prior to deleting?PaV
September 25, 2016
September
09
Sep
25
25
2016
04:42 AM
4
04
42
AM
PDT
Bob O'H: The comment I made was based on the graph in the OP. Would you like to contradict my statement using that graph?PaV
September 25, 2016
September
09
Sep
25
25
2016
04:36 AM
4
04
36
AM
PDT
... cooling during the Younger Dryas ...
... rests on shaky foundations.
It takes about 2mins of googling to find Gore didn’t make this “prediction”.
Say what?Vy
September 25, 2016
September
09
Sep
25
25
2016
03:53 AM
3
03
53
AM
PDT
What particular American politicians say about climate isn't all that relevant to wether science is right about the topic. But... John, if you read carefully you'll find neither of the articles you discuss claim the storm was caused by global warming. Andre, It takes about 2mins of googling to find Gore didn't make this "prediction".wd400
September 25, 2016
September
09
Sep
25
25
2016
01:58 AM
1
01
58
AM
PDT
It’s been getting warmer for the last 15,000 years plus.
*sigh* Look at a plot of the last 15k years and you'll see a different story: cooling during the Younger Dryas, followed by warming and then (until recently) relatively stable global temperatures.Bob O'H
September 25, 2016
September
09
Sep
25
25
2016
01:50 AM
1
01
50
AM
PDT
Al Gore did predict in 2007 that by 2013 the Ice caps would have melted. Has that happened? I rest my case.....Andre
September 24, 2016
September
09
Sep
24
24
2016
08:19 PM
8
08
19
PM
PDT
Here is more irrational hysteria on the part of a so-called media watchdog group, Media Matters, which is anything but unbiased. The introduction should tell you everything you need to know.
For one brief moment over the weekend, Fox News did the unthinkable: acknowledge some of the real-world impacts of climate change in an online article about Tropical Storm Hermine. Soon afterward, though, Fox got back on message, erasing all mentions of global warming from the piece.
http://www.mediamatters.org/blog/2016/09/06/exposed-fox-news-scrubs-climate-change-mention-article-about-tropical-storm-hermine/212858 Again, THERE IS NOTHING UNUSUAL about a hurricane hitting Florida in late August/ early September. Furthermore, Hermine was a very weak category one storm. Listen to me carefully, folks: It had nothing to do with global warming. Fox did the responsible thing by editing out the left wing propaganda and pseudo-science.john_a_designer
September 24, 2016
September
09
Sep
24
24
2016
07:35 PM
7
07
35
PM
PDT
BTW, I just read about a study that tracked the amount of coastline throughout the world. Guess what? It increased by about 44,000 acres (figure off the top of my head). Weren't sea levels supposed to rise? Oh well . . .PaV
September 24, 2016
September
09
Sep
24
24
2016
05:52 PM
5
05
52
PM
PDT
In 1995 the IPCC report said there was no sea level rise acceleration in the 20th century. That was before money corrupted science.BartM
September 24, 2016
September
09
Sep
24
24
2016
03:58 PM
3
03
58
PM
PDT
Here is an example of AGW hype fueled by irrational hysteria:
“Another threat to our country is climate change,” [Hillary Clinton said recently at a campaign event,] “2015 was the hottest year on record, and the science is clear. It’s real. It’s wreaking havoc on communities across America. Last week’s hurricane was another reminder of the devastation that extreme weather can cause, and I send my thoughts and prayers to everyone affected by Hermine… But this is not the last one that’s going to hit Florida, given what’s happening in the climate… Nobody knows that better than folks right here in Tampa and in the broader region. Sea levels have been rising here about an inch per decade since the 1950s. At the rate we are going, by 2030, which is not that far away, $70 billion of coastal property in this state will be flooding at high tide. And whenever our infrastructure is threatened, so too is our homeland security.”
Read more: http://www.bizpacreview.com/2016/09/07/hillary-blames-hermine-climate-change-problem-first-hurricane-make-landfall-fl-11-years-387648#ixzz4LCS7SYRD Florida getting hit in August by a category one hurricane is evidence of climate change? Can someone explain to me the logic behind Mrs. Clinton’s rhetoric? I honestly don’t see it.john_a_designer
September 24, 2016
September
09
Sep
24
24
2016
12:04 PM
12
12
04
PM
PDT
Anyone that wants to make much of this graph might want look up the current atmospheric CO2 concentration and compare it... That the last interglacial was a little warmer than now ("current" in ice core data usually means 1950 btw..) is well known. But the earth was on the downslope of this cycle, having cooled for about 5000 years, prior to us changing the atmosphere. The most important thing to know about the last interglacial is that it's maximum temperature is about in line with the best case scenarios from the ipcc. Sea levels where about 5m higher than today during that time...wd400
September 24, 2016
September
09
Sep
24
24
2016
11:46 AM
11
11
46
AM
PDT
CLAVDIVS:
However, the effect of CO2 on global mean temperature is not linear. This is because not all human CO2 emissions are absorbed by natural sinks, so the levels of CO2 increase via a compounding effect – they are currently at an historical high at around 390 ppm. Historically it has taken from 5000 to 20000 years for CO2 to increase by 100ppm by natural processes. However, the modern increase of 100ppm has taken just 120 years. In addition to this, we have all heard of the runaway greenhouse effect – the more CO2, the higher the mean temperature, which in turn leads to a release of more CO2 from reservoirs, which in turn increases mean temperature, etc…
Textbook alarmist explanation. Now, since none of this can be taken seriously, let me offer a different, purely plausible, view that I now posit just for fun: "Since global temperatures are rising, this likely means less clouds, and more radiant energy striking vegetation throughout the whole planet. Now, since this added radiant energy can be used by plants, then plants should be more vigorous, and grow to larger sizes. Further, since temperatures are higher, the length of time that plants use to grow should be greater (that is, winters shorter and springs longer). And, since plants respire O2 and take in CO2 in photosynthesis, then all things being equal, CO2 levels should fall. And, of course, this means global cooling. And with that cooling, more CO2 will be stored in oceans." We have a Mexican stand-off, it appears. But, now, let me add another scenario: "Let's suppose that the earth's core has a fluctuating temperature over time, perhaps due to gravitational effects in our solar system and local galaxy. Well, if the core heats up ever so slightly over an extended period of time then this added heat must find some route of escape or the whole earth would eventually blow up. So the heat passes through the crust to the bottom of oceans and to the surface of the earth. Now this added heat causes ocean temperatures to rise ever so slightly, and with this rise in temperatures, CO2, held in a solid form in the oceans, will begin to 'melt' and CO2 gas will rise up out of the oceans and into the atmosphere. The heat at the bottom of the ocean will travel to the surface, and the net result will be slightly higher surface temperatures and slightly higher surface water temperatures, and an increase in the amount of CO2 in the atmosphere. Hence, CO2 'lags' behind temperatures of earth's surface and water." Well, I've just explained the graph I posted in the OP. Would you like to use AGW to explain it? Can't be done, of course. But the important point in all of this is that CO2 doesn't 'cause' warming, but is a 'result' of warming. That CO2 invisibly causes there to be more water vapor--the real cause of the "hothouse" effect---is just surmise on the part of interested parties: scientists receiving grants, and businessmen and rich corporations who stand to profit from tax-payer money. I live in California. Arnold Schwarzenegger, as governor, spent $5 billion on global warming. You can surely feel the cooling effects of all that money that was spent, right?PaV
September 24, 2016
September
09
Sep
24
24
2016
11:18 AM
11
11
18
AM
PDT
Seriously? You’re telling me when you look at the chart in the OP the peaks and troughs look random to you?
The universe and life is designed and yet evodelusionists and their theistic brethren say it's randomness. Are you sure you're in a place to be asking such a question?
Vy, that paper is talking about deposition of rocks in the ocean, not ice cores. Did you even read it?
Are the inferences from the Milankovitch cycles with respect to climate exclusive to ice cores?Vy
September 24, 2016
September
09
Sep
24
24
2016
09:32 AM
9
09
32
AM
PDT
Your claims are almost exactly the same as those of Paul Seely @ CMI here:
Seely superficially analyzes the main methods of counting annual layers. He concludes that my reinterpretation is invalid because the timescale has been corroborated by up to three independent annual measuring methods that agree with volcanic acidity spikes and deep-sea cores:
The first 110,000 annual layers of snow in that ice core (GISP2) have been visually counted and corroborated by two to three different and independent methods as well as by correlation with volcanic eruptions and other datable events.
However, contrary to what Seely believes, neither the annual layer counting methods nor the external correlation methods are independent, they are all tied to the same starting assumptions of deep time. The 110,000 annual layers are based on the assumptions that the Greenland Ice Sheet has been in equilibrium for several million years and that ice ages oscillate between glacials and interglacials with a period of 100,000 years based on the astronomical theory of the ice age (the Milankovitch mechanism). Equilibrium means that the annual snowfall and height of the ice sheet have remained nearly constant for several million years. All late ‘Cenozoic’ climatic data sets, including deep-sea cores, must (according to the reigning paradigm) follow this assumed mechanism, which has innumerable problems.6,7,8,9,10 The deep-sea core timescale, based on the astronomical theory of the ice age, provides the timescale for ice cores by dating such events as the Younger Dryas and the stage 5e interglacial in the broad-scale oxygen isotope ratios in ice cores. Then glacial flow models are tuned to this scale, assuming equilibrium of the ice sheets. The flow model then provides the first guess for the annual layer counting. Seely is aware of this bias, but denies it operates in the counting of annual layers:
Contrary to Oard, the expected annual thickness of the layers down the core does not determine what uniformitarian scientists conclude with these latter methods. The truth is exactly the opposite: LLS counting is used to correct the initial estimated thickness of the annual layers.
LLS (laser light scattering) is a method for counting dust bands by passing a laser beam through the ice. Seely is technically correct, but generally incorrect. He must have misinterpreted my statements because such constraints on annual layer thickness do determine the general annual layer thickness within certain limits. I have used the term first guess or estimated annual layer thickness in my articles on the subject:
Based on their expected annual thickness [from flow models], uniformitarian scientists take enough measurements to resolve what they believe are annual cycles.
In other words, the counted annual layers can deviate a little from the first guess, but the first guess constrains the limits of variability. It is like numerical analysis in which a first guess is required to begin and then successive computer iterations change the first guess somewhat to arrive at hopefully the correct answer. For instance, if the first guess concludes that the annual layer thickness at the 2,500-metre depth is around 1 centimetre, annual layer counting will not allow an annual layer thickness of 5 centimetres, let alone about 3 metres as in the creationist model. The variability in the measured parameters and the impact of non-periodic events provide adequate scope to find a preferred fit to the data.
When your dating methods over a certain age are corrected against themselves, the fact that they match up "just right" is not a coincidence. It's more like circular reasoning.Vy
September 24, 2016
September
09
Sep
24
24
2016
09:29 AM
9
09
29
AM
PDT
CLAVDIVS, Aren't you making a design inference with relation to AGW? Hmm.CannuckianYankee
September 24, 2016
September
09
Sep
24
24
2016
09:27 AM
9
09
27
AM
PDT
Vy @ 24 You cite an article that references Dexter, Kowalewski and Read, “Distinguishing Milankovitch-Driven Processes in the Rock Record from Stochasticity Using Computer-Simulated Stratigraphy,” The Journal of Geology, 2009, Volume 117, p. 349-361 as evidence that Milankovitch cycles cannot be distinguished from randomness. Vy, that paper is talking about deposition of rocks in the ocean, not ice cores. Did you even read it?CLAVDIVS
September 24, 2016
September
09
Sep
24
24
2016
09:16 AM
9
09
16
AM
PDT
Vy @ 24 Seriously? You're telling me when you look at the chart in the OP the peaks and troughs look random to you?CLAVDIVS
September 24, 2016
September
09
Sep
24
24
2016
09:10 AM
9
09
10
AM
PDT
Vy We know the eccentricity of the earth's orbit carries the earth closer to the sun at some times, and further away than others, on a cycle of around 100,000 years. We know this because we have measured and calculated the earth's orbit. We know that if the earth is closer to the sun it gets more heat from the sun - even a toddler understands that. We know that when snow falls and is compacted into permafrost it forms observable layers, because we see this happening in the present day. We know that we have counted layers in the ice cores, and measured temperature proxies in those layers. And we know that the temperature proxies from ice-cores follow a cycle every 100,000 layers. My position is: the layers are annual, because its just blindingly obvious and common sense that this is so, based on what we know. Not only that, there are other isotope periodicities in ice cores (and ocean sediments too) that match different rhythmic patterns in the earth's orbit - such as the precession of the equinoxes ~ 20,000 cycle. This is a double-confirmation that the ice layers are annual. Not only that, we can detect material from events - like volcanic eruptions - of known (historical) age in ice layers, and confirm that the count of layers matches the known age of the event. This is triple-confirmation that the ice layers are annual. If your position is that all of this is just a mind-bogglingly improbable coincidence, then fine. You're entitled to your unreasonable opinion. That's why I said ice layers are seen as annual by all reasonably open-minded people.CLAVDIVS
September 24, 2016
September
09
Sep
24
24
2016
09:08 AM
9
09
08
AM
PDT
About that mysteriously "specific" 100,000-year cycle figure, it is more like randomness.Vy
September 24, 2016
September
09
Sep
24
24
2016
09:06 AM
9
09
06
AM
PDT
PaV
According to historical records, temperatures should be expected to rise, irrespective of human CO2 production, which, at the site from which you obtained your chart, is only 1%, not 3.7%, of total CO2. Heavens, that 1% is a real killer.
Your figures appear to be correct: Total atmospheric CO2 = 3.0E12 tons Humans contribute around 2.7E10 tons of CO2 annually, so yes about 1% However, the effect of CO2 on global mean temperature is not linear. This is because not all human CO2 emissions are absorbed by natural sinks, so the levels of CO2 increase via a compounding effect - they are currently at an historical high at around 390 ppm. Historically it has taken from 5000 to 20000 years for CO2 to increase by 100ppm by natural processes. However, the modern increase of 100ppm has taken just 120 years. In addition to this, we have all heard of the runaway greenhouse effect - the more CO2, the higher the mean temperature, which in turn leads to a release of more CO2 from reservoirs, which in turn increases mean temperature, etc... The evidence says adding 1% annually to CO2 can be quite significant.CLAVDIVS
September 24, 2016
September
09
Sep
24
24
2016
08:50 AM
8
08
50
AM
PDT
Yes, the ice-core data completely disproves young-earth creationism.
Unsubstantiated claim.
The cyclic pattern of CO2/CH4 in the ice-core data is due to characteristics of the earth’s orbit that have a known frequency e.g. eccentricity of our orbit that changes the amount of solar radiation the earth receives on an approx 100,000 year cycle. You can see this cycle in the chart clearly.
That's an assumption based on assumptions.
This demonstrates to any reasonably open mind that the ice core layers are in fact annual.
Yet another assumption.Vy
September 24, 2016
September
09
Sep
24
24
2016
08:40 AM
8
08
40
AM
PDT
1 2 3 4 5

Leave a Reply