For some months now, I have been having a behind the scenes correspondence with a regular viewer of UD, whom we shall call EP. He works with industrial robots, and has been fascinated by the way the ribosome works as a nano-scale automated machine cell. Accordingly, a process sequence diagram (‘map”) has been developed, based on accessible descriptions of the ribosome in action. The result is a fascinating look at the ribosome as industrial robot work-cell. (The tRNA’s are molecular scale position-arm devices with a universal CCA coupler — yup, the AA bond is universal, it is the loading enzyme that sets up which tRNA gets what AA — to load and click AAs to a protein chain.)
So, enough introduction, let’s get the show on the road (apologising in advance for the thumbnail, and noting that English is not first language . . . ):
_____________________
EP: >> To fully understand an automated system, several representations of that system are necessary. Normally, technical drawings or blueprints are used for this purpose. Blueprints could be considered maps to simplify the concept because they contain a layout of components with all the measurements and data related to the system represented.
For understanding modern automated systems several maps are usually necessary: mechanical, hydraulic and air equipment layout, electrical power distribution and control layout, data acquisition and other communication networking, safety circuit etc. These are maps of physical aspects of the machine, which are super imposable to represent or describe the whole automated system.
Components of an integrated automated system are physically interrelated in a specific way which enables them to interact in an organized and logical manner.
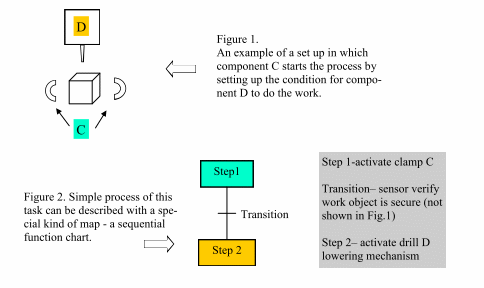
The chart breaks a sequential task down into steps, transitions and actions. These are presented graphically to describe a sequence of interactions as shown in Fig 2. above. Convention requires that flow through the chart is from top to bottom unless indicated by an arrow. The sequence is broken down into steps (or states) where actions are carried out. Each step can include one or more actions. Transitions define logical conditions that cause the process to move from the existing step to the next step.
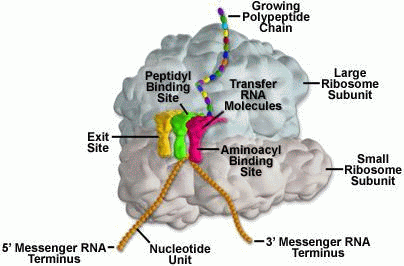
Molecular machine, for example, a ribosome(Fig.3) is a chemical, nano sized integrated system, organized into interrelated subsystems or components. It possesses a set of interacting discrete chemical units with relationships among them enforced by chemical forces. The state of each unit is constrained by or dependent on the state of other units.
Some of ribosome’s recognizable features are: physical proximity of its chemical units; specialization of its units; cooperative nature of interactions of its units; and distinct patterning of its chemical units.
Let’s add Vuk Nikolic’s astonishing video of the process, so we can see what is going on . . .
[vimeo 31830891]
To fully understand this system a map of physical components in not enough. Another map, one showing steps of process flow is necessary. To produce this kind of map, repetitive interactions between ribosome subunits and subunit components should be studied and recognized and presented in the form of a process flow chart.
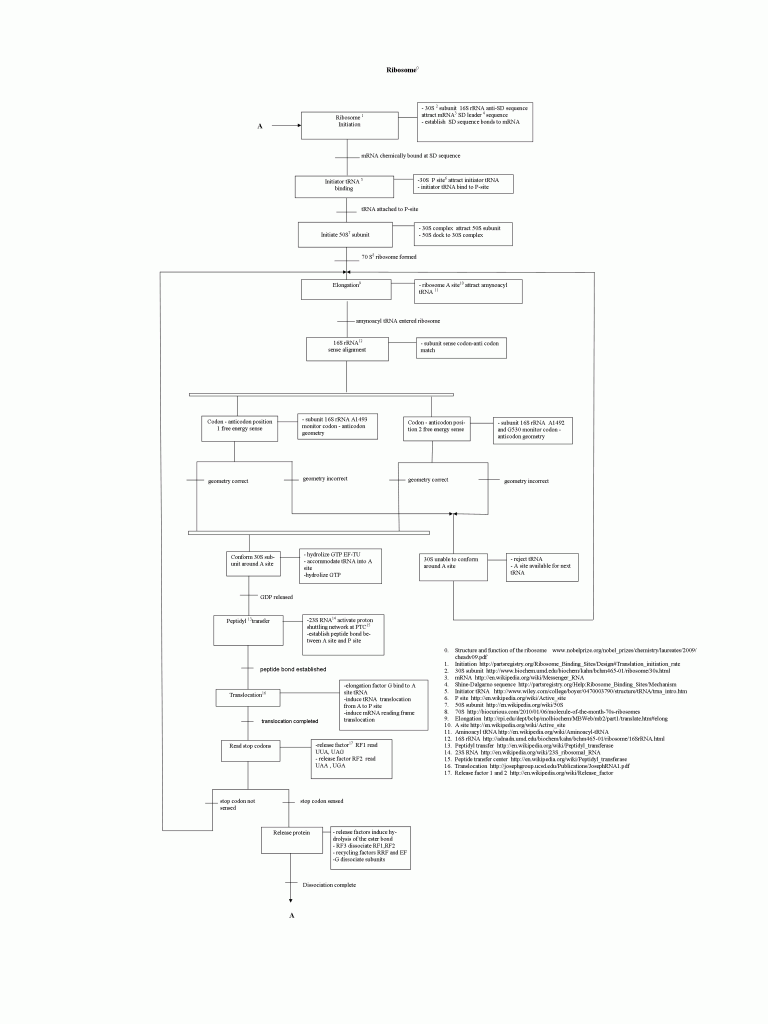
Fig. 4: The EP ribosome process sequence chart, reduced to the size of this page. Pardon, to see the full sized chart, please click here, then click on the image to go to the PNG in your browser window, then click to magnify. It may be useful to simply save and print the image on a sheet of paper. (Alternate site.)
Sequences of interactions, energy and material usage and error control are all easily recognizable on the flow chart type of representation. The advantage of visualizing the process is an instant general overview and easy understanding of process organization.
The process flow is enforced by chemical interactions of ribosome’s components. Interactions in turn are achieved by special arrangements of ribosomal proteins and RNA. Some sections of ribosomal proteins and RNA are coupled to proper influx of energy and material.
During ribosome’s main mode of operation matching amynoacyl tRNA (material deliverer) are accurately attracted from the crowded conditions around ribosome’s A site. Error control is capable of rejecting accidentally attracted non-matching amynoacyl tRNA so that should be the secondary mode of operation. A high error rate would slow protein production.
Footnotes
1. Basic principles of mapping interactions are the same regardless of the domain being mechanical, electro-mechanical or biochemical and regardless of sizes. Interactions of interest are sequential, logical in relation with each other and repetitive. Interactions may proceed in series, in parallel or the combination of two, depending on the components arrangement.
2. Diagram describing ribosome process is Sequential Function Chart (SFC) standard IEC 61131, one of the automation programming languages. Most of the main steps of ribosome’s process were included but some corrections are needed. It is possible to go further and include details down to the last molecule involved. Unfortunately, high detail would make the chart enormous. That was not the purpose of this exercise. Instead, the purpose was meeting a challenge of combining two different fields, biology and automation.
3. Monitoring of third codon-anticodon position is not included in the chart. Scientists explain in the reference article0 “third position is monitored less stringently “.
4. (Musings). It is mindboggling how ribosome manages to accurately attract matching tRNA from crowded conditions in front of A site. All 20 different tRNAs must be available for ribosome’s operation otherwise it will have to pause often. Fortunately, pausing is not costly in terms of energy usage as the elongation factor9 EF Tu delays hydrolyzing of GTP.
Physicist Vlatko Vedral and his team investigated quantum entanglement effects which influence the shape of DNA. I can speculate there is a possibility of the same effects in high accuracy of complementary tRNA attraction. Another possibility is there is a form of amplification of mRNA template codon’s chemical forces via ribosome sub units. >>
______________________
The process sequence map, of course, is a nodes and arcs map, and itself reveals an astonishing functionally specific complex organisation, with implied information.
The ribosome is not merely analogous to a process unit, it is a process unit, only, with a degree of miniaturisation we can only dream of accomplishing. Just for fun, let us compare the innards of a Spinning reel (which is far less complex):
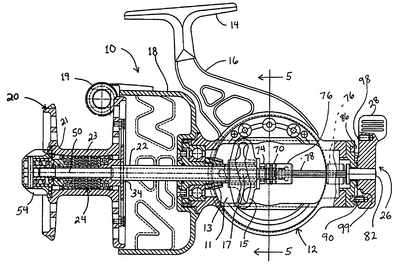
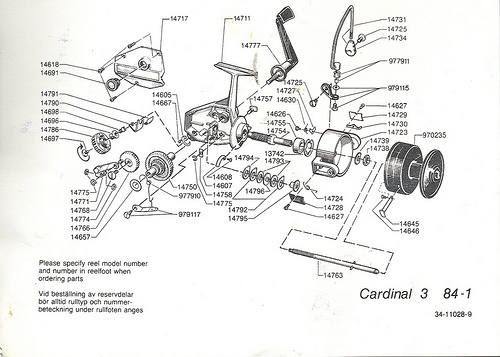
For even more fun, let us look at an exploded view — which is of course a nodes and arcs diagram — of a classic Abu Cardinal:
Fig 6: An exploded view of a classic ABU Cardinal [Fair use, sadly, these babies are no longer made so far as I know . . .], showing how functionality arises from a highly specific, tightly constrained complex arrangement of matched parts according to a Wicken “wiring diagram.” Such wiring diagrams are objective (the FSCO/I on display here that we may become consciously aware of when we see the reel work or fail, is certainly not “question-begging,” as some — astonishingly — are trying to suggest!), and if one is to build or fix such a reel successfully, s/he had better pay close heed. Taking one of these apart and shaking it in a shoe-box is guaranteed not to work to get the reel back together again. As for tornadoes in a junkyard over in Sweden assembling one of these classic babies, not a chance. (That is, even the assembly of such a complex entity is functionally specific and prescriptive information-rich. FSCO/I is objectively real, get over it.)”]
So, now let us ask ourselves, soberly: on our experience of (i) searching for needles in haystacks, and (ii) the routinely observed source of such FSCO/I, what best explains the cell’s protein factory — BTW, the observed source of bio-functional proteins?
Then also, let us ask ourselves a few pointed questions:
1 –> If proteins are reasonably likely to spontaneously form, why would we end up with such an almost Rube Goldbergian apparatus for making proteins in the cell, in a controlled fashion?
2 –> And, given the mRNA code tape that drives the whole process, stored in DNA, then transcribed, snipped up and stitched together [in eukaryotes], then passed to the ribosome, then going through such a complex assembly process, how can we best explain the origin of codes, algorithms, data structures and algorithms implied in that code tape?
3 –>What is all of this trying to tell us about he best explanation for the origin of the metabolising, self-replicating C-chemistry aqueous medium living cell? (Given, that this is the protein-making factory used in the cell hijacked by viri when they want to replicate themselves.)
Then, let us reflect on what our answers tell us about our worldviews and how open we are to reflect on what empirical evidence is revealing to us. END
