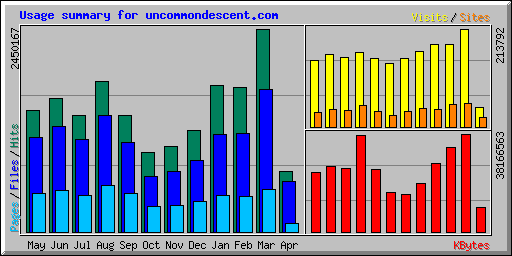
Thanks everyone for helping make another new record high for Uncommon Descent traffic in the month of March.
The graph is a little misleading as March had 10% greater number of days than February. Daily average number of visits (which eliminates the differences in number of days per month) rose from 6430 to 6896, up 7%.
April is shaping up to be far faster growth and indeed the last week of March was more active than the first weeks. I believe we can credit this to the addition of the voting icons at the bottom of each article, particularly Reddit (the last one on the right). So if you see an article you especially enjoy please vote it up by clicking on the Reddit icon. HT to our behind-the-scenes technical wizard Micah Sparacio for the voting icons. Way to go Micah!