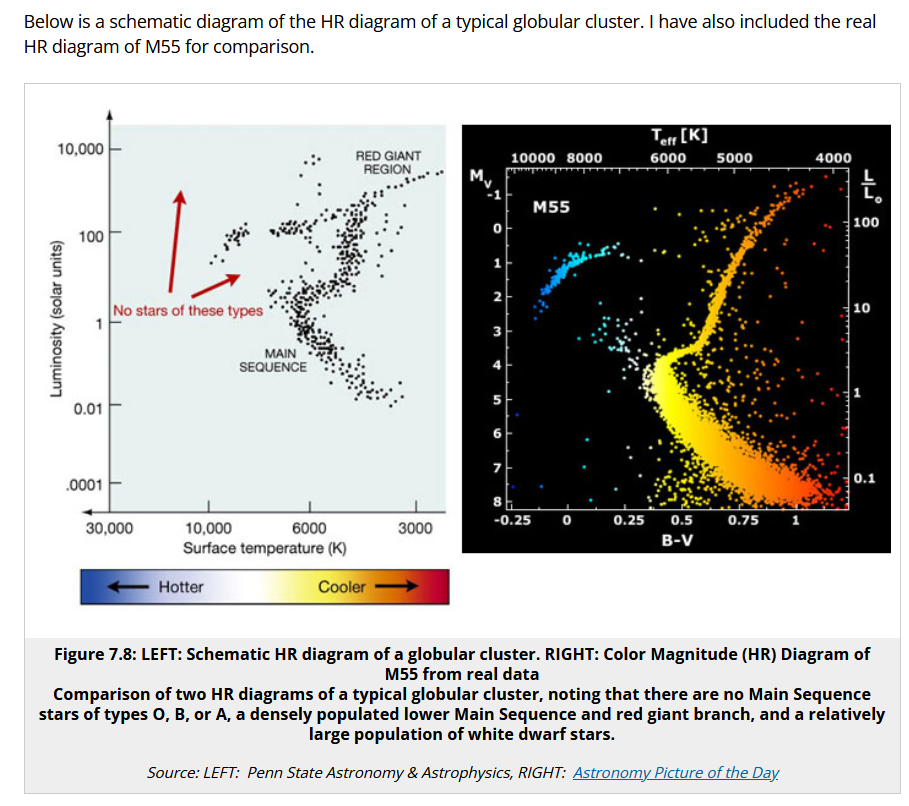
It seems helpful to illustrate cosmological scale apparent aging as stars depart main sequence:

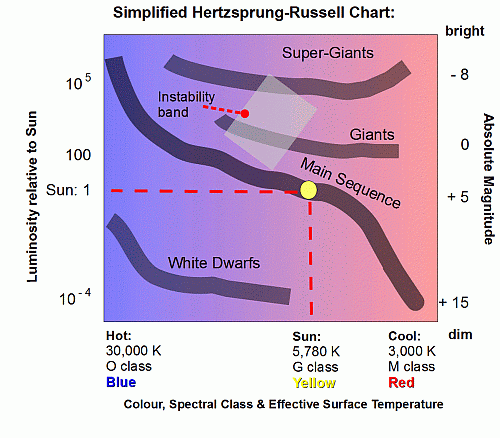
An idealised, Hertzsprung-Russell chart for Hydrogen-rich balls prone to become fusion furnaces is:

Here is a comparative plot (for open clusters), constructing a “clock” by projected pattern as a cluster ages, in effect seeing what is left as a candle burns down:

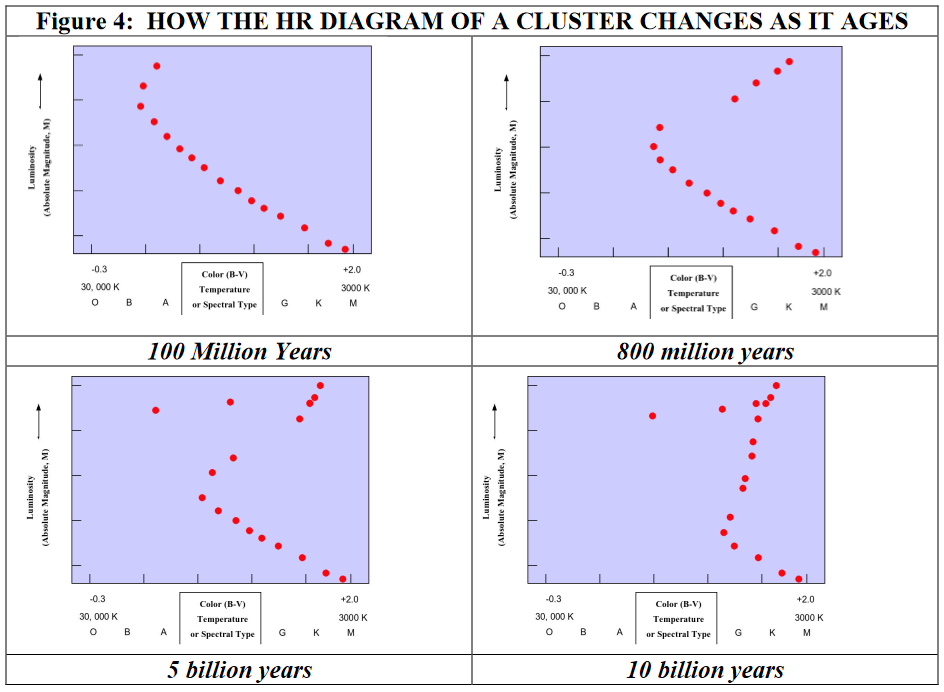
This can be taken as illustrative of how our cosmos shows entropy-associated aging on the grand scale.
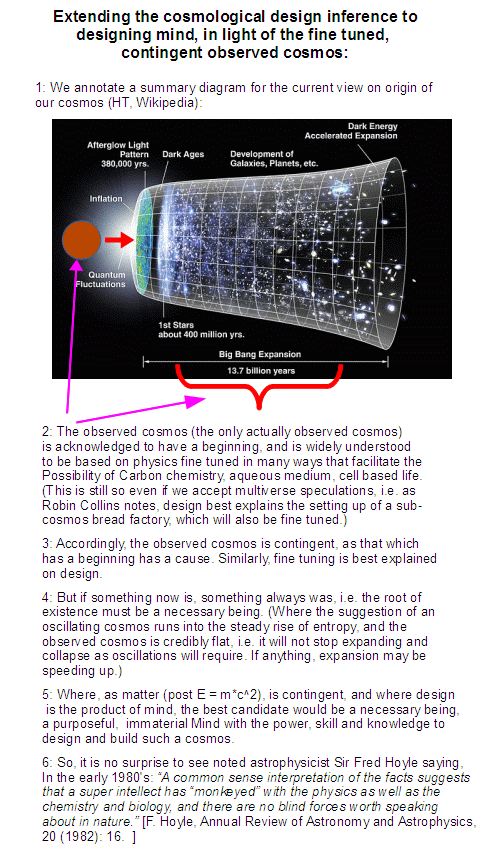
Further illustrative, here is a NASA-derived cosmological timeline model, integrated with fine tuning:

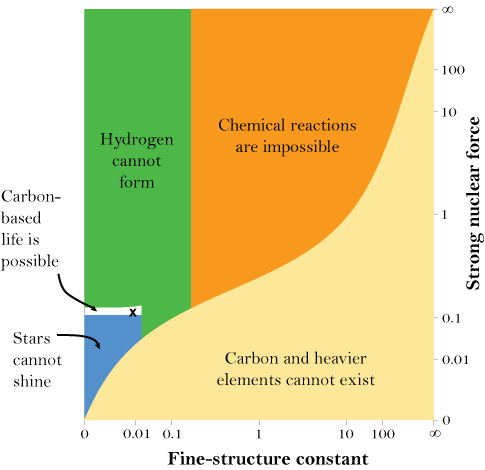
Speaking of fine tuning, Barnes et al summarise:

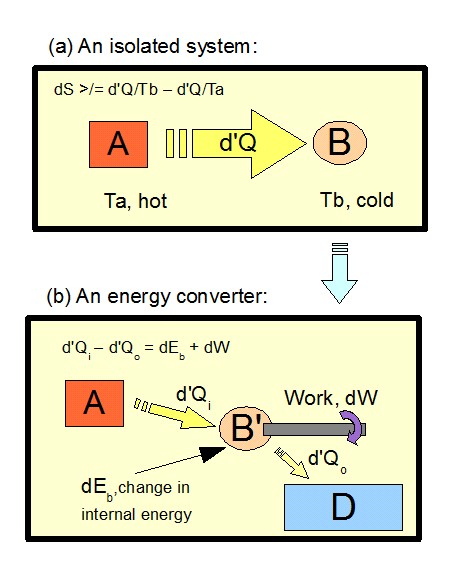
All of this ties to core thermodynamics:

Food for thought. END
Globular Cluster M55 as illustrating apparent aging of our galaxy (& cosmos)
–> As showing apparent effects of entropy at cosmological scale, with side helpings of fine tuning.
–> Also, indicating time at cosmological scale
F/N: I added a “candle burns down” comparative plot for open clusters based on the projected physics of H-rich gas balls prone to become fusion furnaces. KF
PS: Star clusters are generally held to be made up of stars that have formed together and at are about the same distance from us.
F/N: New World Encyclopedia [NWE] has an interesting summary on cosmology beyonde the singularity:
KF
See Halton Arp, who worked with Edwin Hubble, regarding redshift.
https://www.spaceandmotion.com/cosmology/halton-arp-seeing-red-errors-big-bang.htm
M, kindly see https://astronomy.swin.edu.au/cosmos/C/Cosmological+Redshift . It seems distance metrics are an issue. First, stellar parallaxes were first reliably observed and quantified in IIRC the 1830s. Since then, they have been greatly extended, especially in recent years. Next, come delta cepheid variables, rather bright stars inhabiting the band of instability shown in the OP, where there is a sawtooth bright-dim cycle, with a period-brightness law. polaris is a case in point. This, after studies, gave a yardstick to nearby galaxies. Then of course supernovae are standard candles, etc. The pattern is, we have reasonable confidence in scaling out to some 90 bn ly across, with parsecs, parallax seconds a somewhat more useful metric. We have known absorption lines and now observational precision that detects exoplanets using tiny doppler shifts. The Hubble red shift law is strongly supported. Then there is the 2.7 K microwave cavity radiation background, i.e. due to accumulated expansion the cosmos as a whole acts like a Planck cavity radiator at that temperature, connected to cumulative expansion. Variations in this are used to study grand structures. KF
PS, On a subject like this where ideological connexions are fairly remote [but are there] Wiki is fairly accountable to evidence. Accordingly, this summary is useful:
For starters.
The simple answer is that redshift is not what some believe it is. And yes, there are instances where galaxies are moving faster than the speed of light.
Marker: And yes, there are instances where galaxies are moving faster than the speed of light.
Ooo, I am curious. Can you give me a reference?
JVL, there are cases where astronomical objects seem — seem — to be moving faster than c. Unusual circumstances are responsible. I cannot find good cases on a search. In addition, space itself was held to have inflated at speeds beyond c. KF
PS, okay see here https://www.newscientist.com/article/2131889-weird-energy-beam-seems-to-travel-five-times-the-speed-of-light/
DISTRIBUTION OF SUPERLUMINAL VELOCITIES
Proper motions (or upper limits) have now been established in about 33 objects, of which 23 are superluminal, 2 are subluminal, and 8 have upper limits that generally require v < 1.5h-1c. Figure 3 shows the histogram of their apparent transverse velocities; for those sources with more than one moving component only the fastest is plotted. The sample is inhomogeneous and incomplete, but most of the objects were chosen because they are “active''; that is, they are variable and strong, and Fig. 3 is probably representative of core-dominated objects. Thus it is significant that the median velocity corresponds to angle much less than 60°. The median velocity for all objects in Fig. 3 is 3.3h-1c. From Eq. (1)the median “maximum allowed angle'' (for beta = 1) is approximately 34h°, which for 0.5 < h < 1 means that most of the objects are pointed close to our line of sight. Why is there such a strong selection effect? Three possibilities have been suggested.
Source: https://ned.ipac.caltech.edu/level5/ESSAYS/Cohen/cohen.html
Kairosfocus: JVL, there are cases where astronomical objects seem — seem — to be moving faster than c.
Yes, I knew about that; I was curious about the assertion that some objects ARE moving faster than the speed of light.
i would stop for the moment at, appear.
Kairosfocus: i would stop for the moment at, appear.
I concur.