The Intergovernmental Panel On Climate Change (IPCC) drastically understates the warming potential of soot (black carbon) in its report to policy makers. The IPCC has an agenda and that agenda is to blame manmade carbon dioxide emission for climate change. Europe and Asia emit most of the soot from burning coal, wood, dung, and diesel in open fires or without particulate filters in stoves, chimneys, smokestacks, and exhaust pipes. The United States has been restricting soot emissions in Draconian fashion since the Clean Air Act of 1963. The IPCC agenda is really about blaming the United States. I document all this below the fold.
JOURNAL OF GEOPHYSICAL RESEARCH, 2002
Control of fossil-fuel particulate black carbon and organic matter,
possibly the most effective method of slowing global warming
Black Soot and Snow: A Warmer Combination (my emphasis)
NASA News Archive
December 22, 2003New research from NASA scientists suggests emissions of black soot alter the way sunlight reflects off snow. According to a computer simulation, black soot may be responsible for 25 percent of observed global warming over the past century.
Soot in the higher latitudes of the Earth, where ice is more common, absorbs more of the sun’s energy and warmth than an icy, white background. Dark-colored black carbon, or soot, absorbs sunlight, while lighter colored ice reflects sunlight.
Soot in areas with snow and ice may play an important role in climate change. Also, if snow- and ice-covered areas begin melting, the warming effect increases, as the soot becomes more concentrated on the snow surface. “This provides a positive feedback (i.e. warming); as glaciers and ice sheets melt, they tend to get even dirtier,†said Dr. James Hansen, a researcher at NASA’s Goddard Institute for Space Studies, New York.
Hansen and Larissa Nazarenko, both of the Goddard Institute and Columbia University’s Earth Institute, found soot’s effect on snow albedo (solar energy reflected back to space), which has been neglected in previous studies, may be contributing to trends toward early springs in the Northern Hemisphere, thinning Arctic sea ice, melting glaciers and permafrost. Soot also is believed to play a role in changes in the atmosphere above the oceans and land.
“Black carbon reduces the amount of energy reflected by snow back into space, thus heating the snow surface more than if there were no black carbon,†Hansen said.
Soot’s increased absorption of solar energy is especially effective in warming the world’s climate. “This forcing is unusually effective, causing twice as much global warming as a carbon-dioxide forcing of the same magnitude,†Hansen noted.
Scientists Watch Dark Side Of The Moon To Monitor Earth’s Climate
“Earth’s climate is driven by the net sunlight that it absorbs,” says Philip R. Goode, leader of the New Jersey Institute of Technology team, Director of the Big Bear Solar Observatory, and a Distinguished Professor of Physics at NJIT. “We have found surprisingly large–up to 20 percent–seasonal variations in Earth’s reflectance. Further, we have found a hint of a 2.5-percent decrease in Earth’s albedo over the past five years.” If Earth reflected even one percent less light, the effect would be significant enough to be a concern with regard to global warming.
Click here for many more articles about global warming and black soot if the above aren’t enough.
Now after considering these smoking soot guns implicating black carbon with “global warming” in a major way compare Hansen’s (NASA climate researcher) climate forcing factors to the figures in the IPCC 2007 climate report.
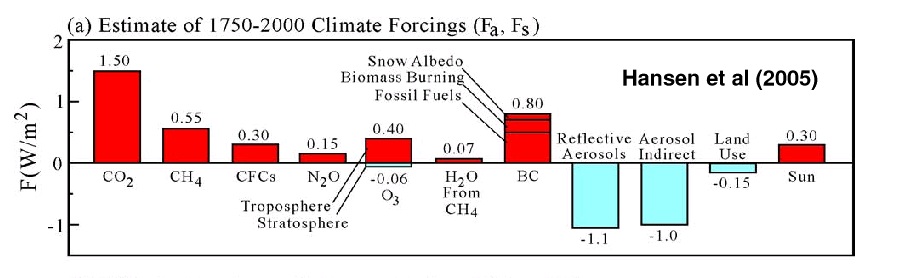
Hansen Forcings: Black Carbon = 0.8 (for higher res image click here)
The IPCC doesn’t mention the number they use for BC forcing in the press releases. You have to dig it out of the details in the 2007 IPCC Assessment Report Physical Science Basis
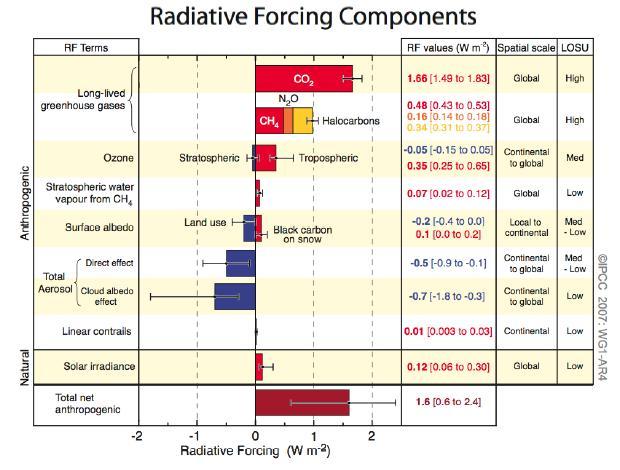
IPCC Forcings: Black Carbon = 0.1 (for higher res image click here)
You’ll find all the forcing factors (Hansen et al vs. IPCC) agree except for black carbon. In Hansen black carbon (BC) is given a forcing factor of 0.8 (a major factor second only to C02) but in the IPCC report it’s given a factor of 0.1 which makes it trivial. Also note Hansen says BC is TWICE AS EFFECTIVE as a CO2 forcing of the same magnitude so we can double that 0.8 to 1.6 so black carbon alone should be equal to CO2 as a source of warming.
But if you have an agenda to blame CO2 and hence the United States then of course you must understate (lie) about black carbon so you don’t put any blame on Europe and Asia. Sickening isn’t it?
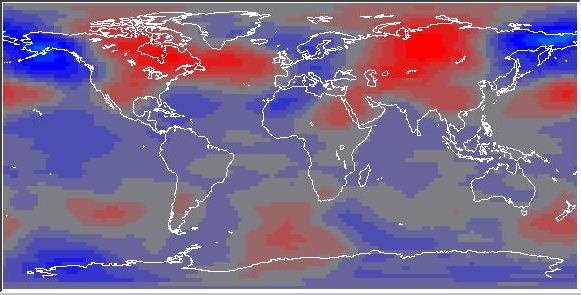
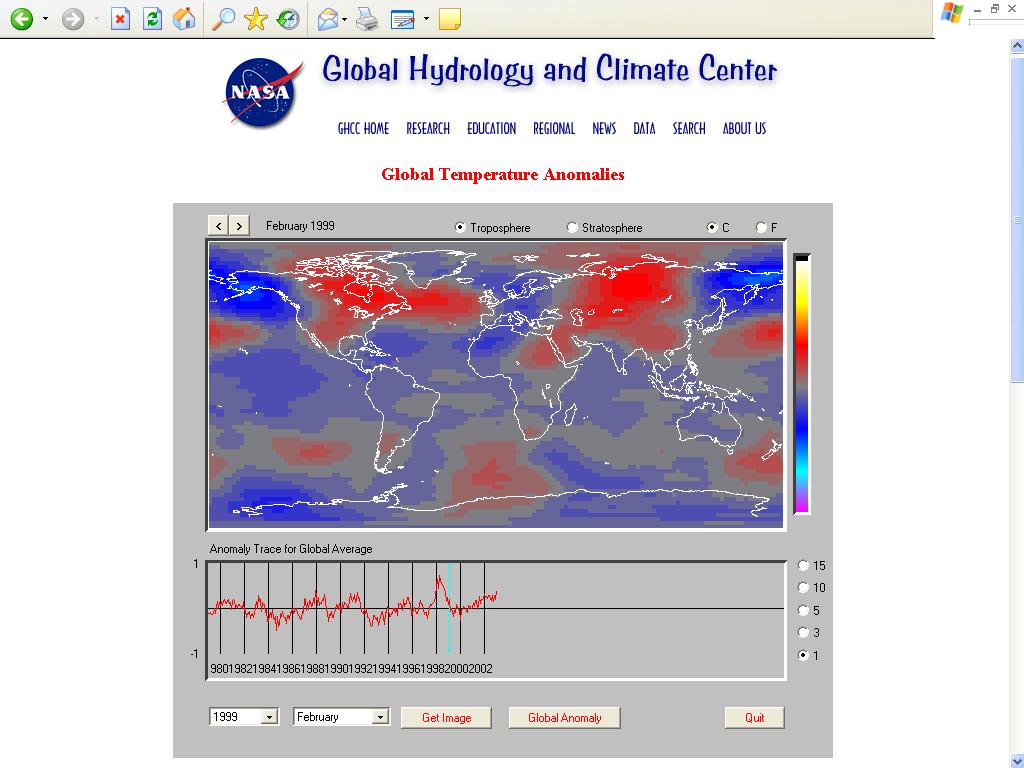
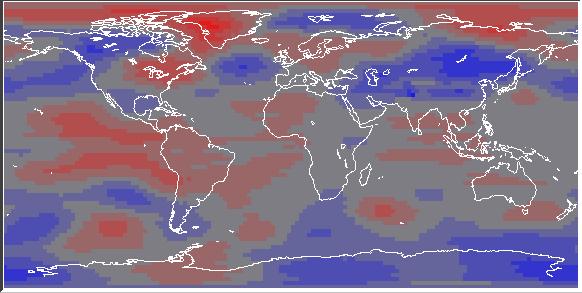
Global Temperature Anomalies: February 1999 From NASA (for higher res image click here)

Soot Density Around the World From NASA
Notice any similarities between the two maps?
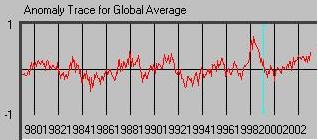
Global Average Temperature 1979-2003 in degrees C Above and Below Normal From NASA
Global Warming is a misnomer. As you can see by the graph of global average temperature it’s cooler than average as much as it is warmer. It should be called Regional Warming.
Temperature anomaly map and graph from NASA’s Interactive Satellite Data Browser. The following explanation (my emphasis) is found there below the data browser. I highly encourage you to browse the data for yourself.
Global temperatures have been monitored by satellite since 1979 with the Microwave Sounding Units (MSU) flying on the National Oceanic and Atmospheric Administration’s (NOAA) TIROS-N series of polar-orbiting weather satellites. Data from nine separate satellites have been combined to provide a global record of temperature fluctuations in the lower troposphere (the lowest 5 miles of the atmosphere) and the lower stratosphere (covering an altitude range of about 9-12 miles). The global image above shows monthly-averaged temperature anomalies (departure from seasonal normals), while the graph shows point or area-averaged anomalies for the entire period of record (since January 1979).
The lower tropospheric data are often cited as evidence against global warming, because they have as yet failed to show any warming trend when averaged over the entire Earth. The lower stratospheric data show a significant cooling trend, which is consistent with ozone depletion. In addition to the recent cooling, large temporary warming perturbations may be seen in the data due to two major volcanic eruptions: El Chichon in March 1982, and Mt. Pinatubo in June 1991.
The high temp in 1998 was due to an unusually strong El Nino – a cyclic event. You can see it in the map below in the eastern Pacific.
1998 El Nino (eastern Pacific) From NASA