Uncommon Descent Serving The Intelligent Design Community

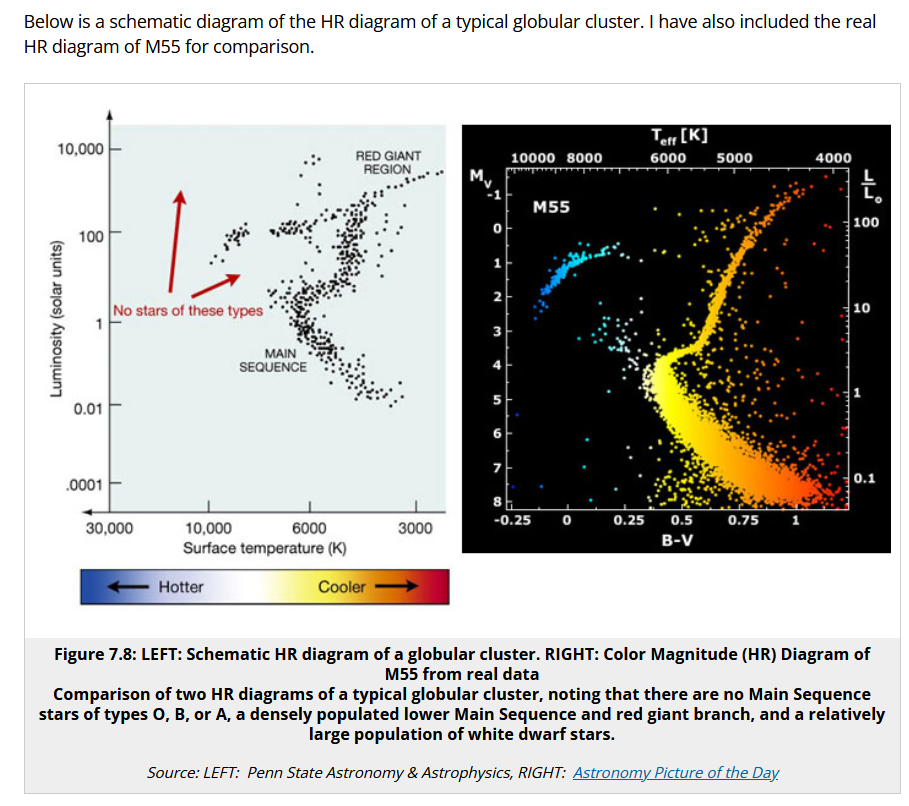
FOR REFERENCE: Globular Cluster M55 as illustrating apparent aging of our galaxy (& cosmos)

Share
Facebook
Twitter
LinkedIn
Flipboard
Print
Email

It seems helpful to illustrate cosmological scale apparent aging as stars depart main sequence:
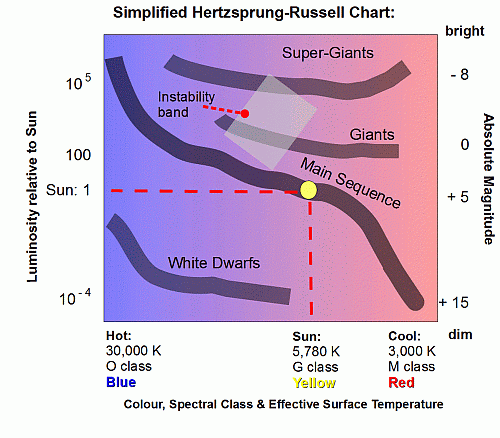
An idealised, Hertzsprung-Russell chart for Hydrogen-rich balls prone to become fusion furnaces is:
Here is a comparative plot (for open clusters), constructing a “clock” by projected pattern as a cluster ages, in effect seeing what is left as a candle burns down:
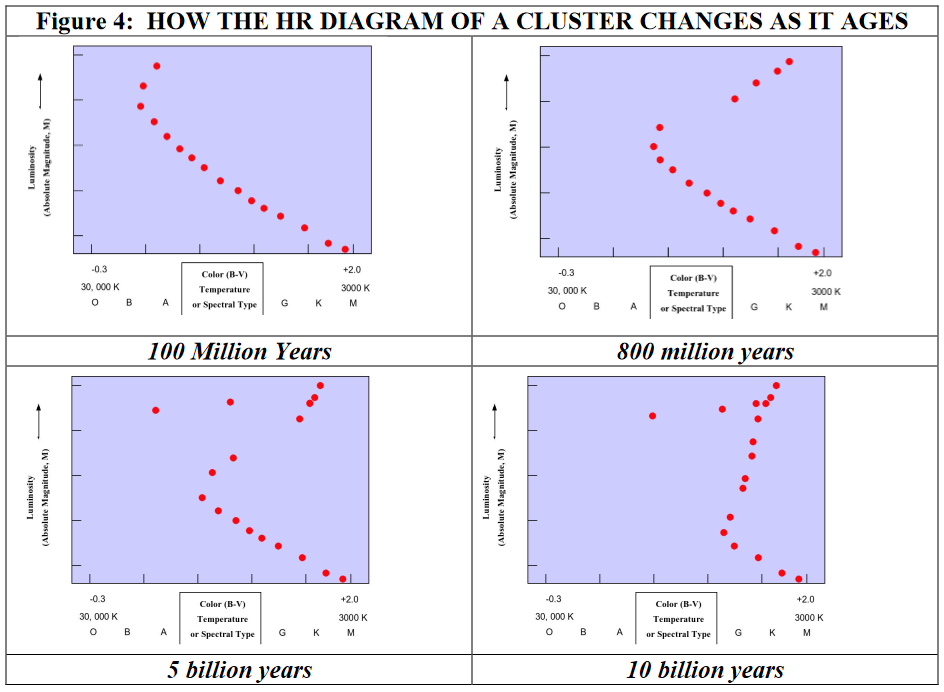
This can be taken as illustrative of how our cosmos shows entropy-associated aging on the grand scale.

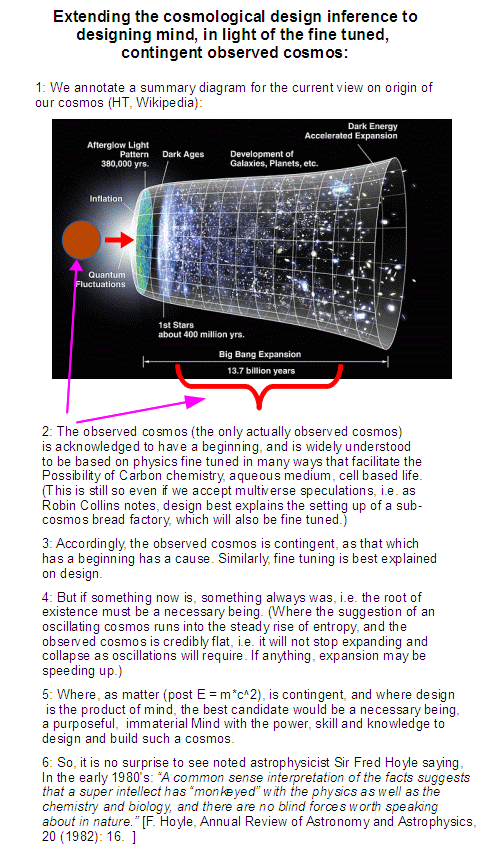
Further illustrative, here is a NASA-derived cosmological timeline model, integrated with fine tuning:
Speaking of fine tuning, Barnes et al summarise:
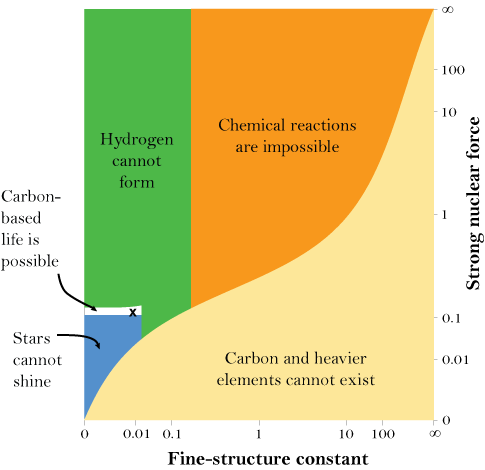
Barnes: “What if we tweaked just two of the fundamental constants? This figure shows what the universe would look like if the strength of the strong nuclear force (which holds atoms together) and the value of the fine-structure constant (which represents the strength of the electromagnetic force between elementary particles) were higher or lower than they are in this universe. The small, white sliver represents where life can use all the complexity of chemistry and the energy of stars. Within that region, the small “x” marks the spot where those constants are set in our own universe.” (HT: New Atlantis)

All of this ties to core thermodynamics:
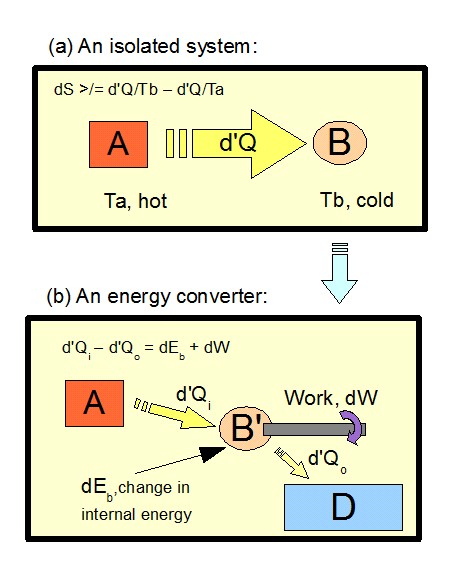
A heat Engine partially converts heat into work

Food for thought. END

Comments
Kairosfocus: i would stop for the moment at, appear. I concur.JVL
May 6, 2022
May
05
May
6
06
2022
08:48 AM
8
08
48
AM
PDT
i would stop for the moment at, appear.kairosfocus
May 6, 2022
May
05
May
6
06
2022
07:05 AM
7
07
05
AM
PDT
Kairosfocus: JVL, there are cases where astronomical objects seem — seem — to be moving faster than c. Yes, I knew about that; I was curious about the assertion that some objects ARE moving faster than the speed of light.JVL
May 4, 2022
May
05
May
4
04
2022
11:18 PM
11
11
18
PM
PDT
DISTRIBUTION OF SUPERLUMINAL VELOCITIES Proper motions (or upper limits) have now been established in about 33 objects, of which 23 are superluminal, 2 are subluminal, and 8 have upper limits that generally require v < 1.5h-1c. Figure 3 shows the histogram of their apparent transverse velocities; for those sources with more than one moving component only the fastest is plotted. The sample is inhomogeneous and incomplete, but most of the objects were chosen because they are ``active''; that is, they are variable and strong, and Fig. 3 is probably representative of core-dominated objects. Thus it is significant that the median velocity corresponds to angle much less than 60°. The median velocity for all objects in Fig. 3 is 3.3h-1c. From Eq. (1)the median ``maximum allowed angle'' (for beta = 1) is approximately 34h°, which for 0.5 < h < 1 means that most of the objects are pointed close to our line of sight. Why is there such a strong selection effect? Three possibilities have been suggested. Source: https://ned.ipac.caltech.edu/level5/ESSAYS/Cohen/cohen.htmlmarker
May 4, 2022
May
05
May
4
04
2022
01:46 PM
1
01
46
PM
PDT
JVL, there are cases where astronomical objects seem -- seem -- to be moving faster than c. Unusual circumstances are responsible. I cannot find good cases on a search. In addition, space itself was held to have inflated at speeds beyond c. KF PS, okay see here https://www.newscientist.com/article/2131889-weird-energy-beam-seems-to-travel-five-times-the-speed-of-light/kairosfocus
May 4, 2022
May
05
May
4
04
2022
11:58 AM
11
11
58
AM
PDT
Marker: And yes, there are instances where galaxies are moving faster than the speed of light. Ooo, I am curious. Can you give me a reference?JVL
May 4, 2022
May
05
May
4
04
2022
09:58 AM
9
09
58
AM
PDT
The simple answer is that redshift is not what some believe it is. And yes, there are instances where galaxies are moving faster than the speed of light.marker
May 4, 2022
May
05
May
4
04
2022
08:12 AM
8
08
12
AM
PDT
M, kindly see https://astronomy.swin.edu.au/cosmos/C/Cosmological+Redshift . It seems distance metrics are an issue. First, stellar parallaxes were first reliably observed and quantified in IIRC the 1830s. Since then, they have been greatly extended, especially in recent years. Next, come delta cepheid variables, rather bright stars inhabiting the band of instability shown in the OP, where there is a sawtooth bright-dim cycle, with a period-brightness law. polaris is a case in point. This, after studies, gave a yardstick to nearby galaxies. Then of course supernovae are standard candles, etc. The pattern is, we have reasonable confidence in scaling out to some 90 bn ly across, with parsecs, parallax seconds a somewhat more useful metric. We have known absorption lines and now observational precision that detects exoplanets using tiny doppler shifts. The Hubble red shift law is strongly supported. Then there is the 2.7 K microwave cavity radiation background, i.e. due to accumulated expansion the cosmos as a whole acts like a Planck cavity radiator at that temperature, connected to cumulative expansion. Variations in this are used to study grand structures. KF PS, On a subject like this where ideological connexions are fairly remote [but are there] Wiki is fairly accountable to evidence. Accordingly, this summary is useful:
The first Doppler redshift was described by French physicist Hippolyte Fizeau in 1848, who pointed to the shift in spectral lines seen in stars as being due to the Doppler effect. The effect is sometimes called the "Doppler–Fizeau effect". In 1868, British astronomer William Huggins was the first to determine the velocity of a star moving away from the Earth by this method.[4] In 1871, optical redshift was confirmed when the phenomenon was observed in Fraunhofer lines using solar rotation, about 0.1 Å in the red.[5] In 1887, Vogel and Scheiner discovered the annual Doppler effect, the yearly change in the Doppler shift of stars located near the ecliptic due to the orbital velocity of the Earth.[6] In 1901, Aristarkh Belopolsky verified optical redshift in the laboratory using a system of rotating mirrors.[7] The earliest occurrence of the term red-shift in print (in this hyphenated form) appears to be by American astronomer Walter S. Adams in 1908, in which he mentions "Two methods of investigating that nature of the nebular red-shift".[8] The word does not appear unhyphenated until about 1934 by Willem de Sitter, perhaps indicating that up to that point its German equivalent, Rotverschiebung, was more commonly used.[9] Beginning with observations in 1912, Vesto Slipher discovered that most spiral galaxies, then mostly thought to be spiral nebulae, had considerable redshifts. Slipher first reports on his measurement in the inaugural volume of the Lowell Observatory Bulletin.[10] Three years later, he wrote a review in the journal Popular Astronomy.[11] In it he states that "the early discovery that the great Andromeda spiral had the quite exceptional velocity of –300 km(/s) showed the means then available, capable of investigating not only the spectra of the spirals but their velocities as well."[12] Slipher reported the velocities for 15 spiral nebulae spread across the entire celestial sphere, all but three having observable "positive" (that is recessional) velocities. Subsequently, Edwin Hubble discovered an approximate relationship between the redshifts of such "nebulae" and the distances to them with the formulation of his eponymous Hubble's law.[13] These observations corroborated Alexander Friedmann's 1922 work, in which he derived the Friedmann–Lemaître equations.[14] They are today considered strong evidence for an expanding universe and the Big Bang theory.[15] The spectrum of light that comes from a source (see idealized spectrum illustration top-right) can be measured. To determine the redshift, one searches for features in the spectrum such as absorption lines, emission lines, or other variations in light intensity. If found, these features can be compared with known features in the spectrum of various chemical compounds found in experiments where that compound is located on Earth. A very common atomic element in space is hydrogen. The spectrum of originally featureless light shone through hydrogen will show a signature spectrum specific to hydrogen that has features at regular intervals. If restricted to absorption lines it would look similar to the illustration (top right). If the same pattern of intervals is seen in an observed spectrum from a distant source but occurring at shifted wavelengths, it can be identified as hydrogen too. If the same spectral line is identified in both spectra—but at different wavelengths—then the redshift can be calculated using the table below. Determining the redshift of an object in this way requires a frequency or wavelength range. In order to calculate the redshift, one has to know the wavelength of the emitted light in the rest frame of the source: in other words, the wavelength that would be measured by an observer located adjacent to and comoving with the source. Since in astronomical applications this measurement cannot be done directly, because that would require traveling to the distant star of interest, the method using spectral lines described here is used instead. Redshifts cannot be calculated by looking at unidentified features whose rest-frame frequency is unknown, or with a spectrum that is featureless or white noise (random fluctuations in a spectrum).[17] Redshift (and blueshift) may be characterized by the relative difference between the observed and emitted wavelengths (or frequency) of an object. In astronomy, it is customary to refer to this change using a dimensionless quantity called z . . . . In the earlier part of the twentieth century, Slipher, Wirtz and others made the first measurements of the redshifts and blueshifts of galaxies beyond the Milky Way. They initially interpreted these redshifts and blueshifts as being due to random motions, but later Lemaître (1927) and Hubble (1929), using previous data, discovered a roughly linear correlation between the increasing redshifts of, and distances to, galaxies. Lemaître realized that these observations could be explained by a mechanism of producing redshifts seen in Friedmann's solutions to Einstein's equations of general relativity. The correlation between redshifts and distances is required by all such models that have a metric expansion of space.[15] As a result, the wavelength of photons propagating through the expanding space is stretched, creating the cosmological redshift. There is a distinction between a redshift in cosmological context as compared to that witnessed when nearby objects exhibit a local Doppler-effect redshift. Rather than cosmological redshifts being a consequence of the relative velocities that are subject to the laws of special relativity (and thus subject to the rule that no two locally separated objects can have relative velocities with respect to each other faster than the speed of light), the photons instead increase in wavelength and redshift because of a global feature of the spacetime through which they are traveling. One interpretation of this effect is the idea that space itself is expanding.[25] Due to the expansion increasing as distances increase, the distance between two remote galaxies can increase at more than 3×10⁸ m/s, but this does not imply that the galaxies move faster than the speed of light at their present location (which is forbidden by Lorentz covariance).
For starters.kairosfocus
May 3, 2022
May
05
May
3
03
2022
10:17 PM
10
10
17
PM
PDT
See Halton Arp, who worked with Edwin Hubble, regarding redshift. https://www.spaceandmotion.com/cosmology/halton-arp-seeing-red-errors-big-bang.htmmarker
May 3, 2022
May
05
May
3
03
2022
10:10 AM
10
10
10
AM
PDT
F/N: New World Encyclopedia [NWE] has an interesting summary on cosmology beyonde the singularity:
Speculative physics beyond the Big Bang While the Big Bang model is well established in cosmology, it is likely to be refined in the future. Little is known about the earliest moments of the universe's history. The Penrose-Hawking singularity theorems require the existence of a singularity at the beginning of cosmic time. However, these theorems assume that general relativity is correct, but general relativity must break down before the universe reaches the Planck temperature, and a correct treatment of quantum gravity may avoid the singularity.[21] There may also be parts of the universe well beyond what can be observed in principle. If inflation occurred this is likely, for exponential expansion would push large regions of space beyond our observable horizon. Some proposals, each of which entails untested hypotheses, are: Models including the Hartle-Hawking boundary condition in which the whole of space-time is finite; the Big Bang does represent the limit of time, but without the need for a singularity.[43] Brane cosmology models[44] in which inflation is due to the movement of branes in string theory; the pre-big bang model; the ekpyrotic model, in which the Big Bang is the result of a collision between branes; and the cyclic model, a variant of the ekpyrotic model in which collisions occur periodically.[45][46] Chaotic inflation, in which inflation events start here and there in a random quantum-gravity foam, each leading to a bubble universe expanding from its own big bang.[47][48] Proposals in the last two categories see the Big Bang as an event in a much larger and older universe, or multiverse, and not the literal beginning.
KFkairosfocus
May 3, 2022
May
05
May
3
03
2022
09:14 AM
9
09
14
AM
PDT
F/N: I added a "candle burns down" comparative plot for open clusters based on the projected physics of H-rich gas balls prone to become fusion furnaces. KF PS: Star clusters are generally held to be made up of stars that have formed together and at are about the same distance from us.kairosfocus
May 1, 2022
May
05
May
1
01
2022
09:43 AM
9
09
43
AM
PDT
Globular Cluster M55 as illustrating apparent aging of our galaxy (& cosmos) --> As showing apparent effects of entropy at cosmological scale, with side helpings of fine tuning. --> Also, indicating time at cosmological scalekairosfocus
May 1, 2022
May
05
May
1
01
2022
06:02 AM
6
06
02
AM
PDT

Leave a Reply