Uncommon Descent Serving The Intelligent Design Community

How Can Anyone Be Serious about AGW?

Share
Facebook
Twitter
LinkedIn
Flipboard
Print
Email

Here’s a graph from the IPCC. I just happened upon it.
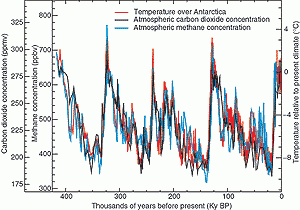
IPCC Report Fig 2.22  Historic Record of Temp, CO2 and Methane
IPCC Report Fig 2.22 Historic Record of Temp, CO2 and Methane from Antartic Icecores.

Notice that, historically, global temperatures were, cyclically, about 4 degrees warmer than now. Just look at the repeated cycle! It’s been getting warmer for the last 15,000 years plus.

AGW is just a farce. And the IPCC itself makes this point.

Comments
CLAVDIVS: It's amazingly simple to see that the world was hotter in the past, and that humans were not the cause of it. That you want to say that temperatures should be cooling, based on your look at the graph, is fine with me. That's exactly what might be going on. I made this point earlier. Isn't it clear that for the last 25,000 years, or so, temperatures have been going up. Obviously it isn't because of man-made CO2. According to historical records, temperatures should be expected to rise, irrespective of human CO2 production, which, at the site from which you obtained your chart, is only 1%, not 3.7%, of total CO2. Heavens, that 1% is a real killer. Obviously, the world has survived higher temperatures. "The sky is falling; the sky is falling!" What would liberals do without a "crisis"?PaV
September 24, 2016
September
09
Sep
24
24
2016
08:22 AM
8
08
22
AM
PDT
Here is an interesting article that discusses the alleged historical correlation between CO2 and temperature. Whatever correlation exists, it doesn’t support AGW. High levels of CO2 (even higher than today) appeared tens of thousands of years ago before the appearance human civilization and industrialization. Furthermore, elevated levels of CO2 did not lead to run-away and irreversible global warming. Abstract:
Recent discussion of the Shakun et al. (Nature 2012) paper has illuminated issues in its presentation of the history of CO2 versus temperature… In addition to those investigations, another helpful approach may be to take a step back and cross-check with other sources. In general, does CO2 correlate with temperature in climate history? The answer is often yes on “medium” timescales, but no on “short” timescales and also no on the very longest timescales of all. If one looks at all three timescales, overall observations are consistent with temperature rise causing the oceans to release part of their dissolved CO2 after substantial lag time, yet not consistent with CO2 being the primary driver of climate. Over the past few hundred thousand years of ice core data, a “medium” time scale in this sense, CO2 superficially appears to change in step with temperature if a graph is so zoomed out as to not show sub-millennial time scales well:
https://wattsupwiththat.com/2012/04/11/does-co2-correlate-with-temperature-history-a-look-at-multiple-timescales-in-the-context-of-the-shakun-et-al-paper/ BTW I am very much in favor in reducing CO2 emissions but for “local” environmental reasons, not “global” the sky-is-falling kind of hysteria. I would suggest we build more nuclear power plants. They emit zero CO2.john_a_designer
September 24, 2016
September
09
Sep
24
24
2016
08:20 AM
8
08
20
AM
PDT
No PaV. You have misunderstood my amazingly simple point. The temperature (in blue on my chart, in red on your chart), breaks the historical pattern. It should be decreasing right now, according to the "sawtooth" pattern, where the temperature sharply increases to a 'spike' and then immediately declines sharply. However, in recent times this pattern is not observed. This break in pattern is evident in the picture you posted - I'm just pointing it out. (ETA: The break in pattern is more obvious in the 2014 chart I posted than in the chart you posted which is based on data collected 1995-1999.) I also, as a separate matter, mentioned the massive, unprecedented level of modern CO2 that only appears on my chart. Currently CO2 is at about 390 parts per million; ice core data show an historical maximum of no more than 300 parts per million.CLAVDIVS
September 24, 2016
September
09
Sep
24
24
2016
08:13 AM
8
08
13
AM
PDT
CLAUDIVS: I just visited the site you got your graph from. How interesting that it is a site that debunks global warming. The chart you've presented is taken from May 2014 blog entry overlaying temperatures and CO2 levels. The point they were making in this anti-AGW blog was that CO2 levels "lag behind" temperature; not the other way around. Your statement that the temperature is "breaking the historical pattern" comes from you interpreting CO2 levels, in red, for the actual temperatures, which are in blue. You'll notice no such "break" in historical temperatures: which was, of course, my whole point in posting the graph in the first place.PaV
September 24, 2016
September
09
Sep
24
24
2016
08:00 AM
8
08
00
AM
PDT
CLAVDIVS: Where did this graph of yours appear from? It looks like the "hockey stick" version of the graph I posted above. As you know, Mann's methods in arriving at this "hockey stick" are suspect at best, and downright devious at worst. And, BTW, scientists are predicting cooling in the near future. And, in the 1980's, they awaited a significant cooling period, before they installed digital measuring devices, corrected them, and then declared that runaway temperature rises were on the way. Again, where did this graph come from? And how was it 'adjusted'?PaV
September 24, 2016
September
09
Sep
24
24
2016
07:44 AM
7
07
44
AM
PDT
Vy @ 12 Yes, the ice-core data completely disproves young-earth creationism. The cyclic pattern of CO2/CH4 in the ice-core data is due to characteristics of the earth's orbit that have a known frequency e.g. eccentricity of our orbit that changes the amount of solar radiation the earth receives on an approx 100,000 year cycle. You can see this cycle in the chart clearly. This demonstrates to any reasonably open mind that the ice core layers are in fact annual.CLAVDIVS
September 24, 2016
September
09
Sep
24
24
2016
07:43 AM
7
07
43
AM
PDT
Mr Arrington Of course I 'admit' in the past it was much warmer than it is now due to purely natural forces. This is taught at school round here. Here is a version of the chart in the OP with very recent data shown more clearly: https://globalfreezingyourassoff.files.wordpress.com/2014/05/400000yearslarge1.gif You can see the massive, unprecedented spike in CO2 in recent times and the temperature breaking the historical pattern - which was my point @ 10.CLAVDIVS
September 24, 2016
September
09
Sep
24
24
2016
07:30 AM
7
07
30
AM
PDT
Of related note to AGW alarmism, The Climate Is Not Clear for ChangeVy
September 24, 2016
September
09
Sep
24
24
2016
06:04 AM
6
06
04
AM
PDT
CLAVDIVS, Your fellow alarmist (rvb8) chose to rant instead of address the thrust of the OP. Telling, very telling. You take another tack, choosing to redirect from the glaringly obvious and indisputable. I will lay it out for your one more time: The point of the graph is that in the past it was a lot hotter than it is now. When it was getting hotter, the increase in heat was not caused by human activity. Now, pay attention here, this is the point: It follows that when it got hotter, even much hotter, than it is now, purely natural forces where the cause. Here's a simple question which I expect you to evade or ignore, but I will ask anyway: Do you admit that in the past it was much warmer than it is now and that purely natural forces were the cause?Barry Arrington
September 24, 2016
September
09
Sep
24
24
2016
05:46 AM
5
05
46
AM
PDT
Of related note: The ice core data completely disproves young-earth creationism.
Mhmm. Does it really? Completely?Vy
September 24, 2016
September
09
Sep
24
24
2016
05:26 AM
5
05
26
AM
PDT
Isn't the graph a reflection of half a million years of ice ages?Seqenenre
September 24, 2016
September
09
Sep
24
24
2016
04:57 AM
4
04
57
AM
PDT
PaV Based on the pattern in your graph, in the present day we should be experiencing cooling. Instead we are warming up. This is prima facie evidence that current warming is not part of that natural cycle.CLAVDIVS
September 24, 2016
September
09
Sep
24
24
2016
02:51 AM
2
02
51
AM
PDT
Of related note: The ice core data completely disproves young-earth creationism.CLAVDIVS
September 24, 2016
September
09
Sep
24
24
2016
02:24 AM
2
02
24
AM
PDT
Some see evolution everywhere, some see climate change everywhere. Me, I see design everywhere. Design. Everywhere. Waning gibbous Harvest Moon. Very awesome:)ppolish
September 24, 2016
September
09
Sep
24
24
2016
01:09 AM
1
01
09
AM
PDT
rvb8: This comment cannot go unanswered:
Alternatively, you could cherry pick one graph, that supposedly supports your position, and ignore the afore mentioned mountain of evidence. Hmm, I wonder what this amazingly science orientated site will do?
This is simply elitist brow-beating. Nothing more. There's plenty of science at this site, when warranted. The problem with Darwinism--and supposed AGW---is that contradictory evidence is routinely ignored. There's a word for it: "unfalsifiability." And any theory that is 'unfalsifiable,' cannot truly form the basis of what we would call 'science.' Climate models are most accurate in their earliest predictions, with uncertainties mounting as they work into the future. What do we SEE (at least those of us with our eyes open)? A complete disconnect between computer model predictions and actual temperatures. But why let actual facts get into your way. After all, you're a "real" scientist. Please come back when you have real facts that point to something real. Hand-waving is not allowed at UD.PaV
September 24, 2016
September
09
Sep
24
24
2016
12:41 AM
12
12
41
AM
PDT
rvb8: You arrogantly assume your view is correct. Now, tell me, looking at this graph: (1) Was anthropogenic CO2 the cause for these four cycles spanning 400,000 years? I'll presume your answer is "no." Then, (2) based on the graph as shown, and, from your presumed "no" to question (1), from natural processes alone, what do you expect the temperature to be, relative to our present-day temperatures over the next few thousand years? (3) Are you willing to admit that world temperatures were warmer--by almost 4 degrees than today---in the past? And, BTW, things really aren't warming up, are they? Not for the last twenty years; and, even admitted to by the alarmists, into the near future. So much, I must say, for those vaunted climate models. AGW alarmism will be proof-positive in the end of the saying we've heard now for decades: "junk in"; "junk out."PaV
September 24, 2016
September
09
Sep
24
24
2016
12:32 AM
12
12
32
AM
PDT
rvb8
Go to all the serious universities (maybe not Bob Jones’s fine establishment), to ALL national science agencies, to all miltary structures (inside the US and without), to ALL insurance companies etc etc, and I am afraid BA you will be dissapointed.
Actually, any educated person who knows how to read a scientific report knows that the Darwinists and climate change freaks are all liars--institutionally protected liars to be sure--but liars nonetheless.StephenB
September 23, 2016
September
09
Sep
23
23
2016
10:17 PM
10
10
17
PM
PDT
Heh:) "Unfalsifiable Woo-Woo psuedoscience." Go to all the serious universities (maybe not Bob Jones's fine establishment), to ALL national science agencies, to all miltary structures (inside the US and without), to ALL insurance companies etc etc, and I am afraid BA you will be dissapointed. However, screed on! Likewise the other psuedoscience; evolution!rvb8
September 23, 2016
September
09
Sep
23
23
2016
09:29 PM
9
09
29
PM
PDT
Global warming is a scam. The so called mountain of evidence, much like the evidence for Darwinian evolution, only exists in the imagination of true believers. And also much like Darwinian evolution, Global warming is " Unfalsifiable Woo-Woo Pseudoscience"
Climate Change is Unfalsifiable Woo-Woo Pseudoscience - video https://www.youtube.com/watch?v=huKY5DzrcLI
Frankly, I stopped taking 'the sky is falling Chicken Littles' of Global warming seriously after the deliberately deceptive hockey stick 'hide the decline' fiasco several years back, i.e. 'Climate Gate':
Hide the decline - satire on global warming alarmists https://www.youtube.com/watch?v=WMqc7PCJ-nc Climate Alarmism Has Undermined Science Itself - June 20, 2015 Excerpt: There was the southern hemisphere hockey-stick that had been created by the omission of inconvenient data series. There was the infamous “hide the decline” incident when a tree-ring-derived graph had been truncated to disguise the fact that it seemed to show recent cooling. And of course there was the mother of all scandals, the “hockey stick” itself: a graph that purported to show the warming of the last three decades of the twentieth century as unprecedented in a millennium, a graph that the IPCC was so thrilled with that it published it six times in its third assessment report and displayed it behind the IPCC chairman at his press conference. It was a graph that persuaded me to abandon my scepticism (until I found out about its flaws), because I thought Nature magazine would never have published it without checking. And it is a graph that was systematically shown by Steven McIntyre and Ross McKitrick to be wholly misleading, as McKitrick recounts in glorious detail in his chapter in The Facts. Its hockey-stick shape depended heavily on one set of data from bristlecone pine trees in the American south-west, enhanced by a statistical approach to over-emphasise some 200 times any hockey-stick shaped graph. Yet bristlecone tree-rings do not, according to those who collected the data, reflect temperature at all. What is more, the scientist behind the original paper, Michael Mann, had known all along that his data depended heavily on these inappropriate trees and a few other series, because when finally prevailed upon to release his data he accidentally included a file called “censored” that proved as much: he had tested the effect of removing the bristlecone pine series and one other, and found that the hockey-stick shape disappeared. In March this year Dr Mann published a paper claiming the Gulf Stream was slowing down. This garnered headlines all across the world. Astonishingly, his evidence that the Gulf Stream is slowing down came not from the Gulf Stream, but from “proxies” which included—yes—bristlecone pine trees in Arizona, upside-down lake sediments in Scandinavia and larch trees in Siberia. https://uncommondescent.com/intelligent-design/climate-alarmism-has-undermined-science-itself/
bornagain77
September 23, 2016
September
09
Sep
23
23
2016
08:28 PM
8
08
28
PM
PDT
So now the IPCC is a reliable source of AGW data? Did you look at the mountain of evidence at that site? I do, regularly. Go read it, just casually, and then return and make yout poor assertions again. Don't read the scientists there too closely though, you might learn something. Alternatively, you could cherry pick one graph, that supposedly supports your position, and ignore the afore mentioned mountain of evidence. Hmm, I wonder what this amazingly science orientated site will do?rvb8
September 23, 2016
September
09
Sep
23
23
2016
07:58 PM
7
07
58
PM
PDT
Semi related: I am now reading Dr. Hugh Ross's new book "Improbable Planet: How Earth Became Humanity's Home" which was published September 6th 2016
Improbable Planet: How Earth Became Humanity's Home https://www.amazon.com/Improbable-Planet-Earth-Became-Humanitys/dp/0801016894
If anyone thinks that the habitability of earth is just a fluke and that humans are not really intended to be here, using the resources of the earth for our benefit, and believes that humans themselves are merely 'random' accidents (which is, IMHO, the basic philosophy behind the entire Global warming scare), then this is the book for you.
From the Inside Flap Are we really just the result of innumerable coincidences? Or is there a more reasonable explanation? Most of us remember the basics from science classes about how Earth came to be the only known planet that sustains complex life. But what most people don't know is that the more thoroughly researchers investigate the history of our planet, the more astonishing the story of our existence becomes. The number and complexity of the astronomical, geological, chemical, and biological features recognized as essential to human existence have expanded explosively within the past decade. An understanding of what is required to make possible a large human population and advanced civilizations has raised profound questions about life, our purpose, and our destiny. This fascinating book helps nonscientists understand the countless miracles that undergird the exquisitely fine-tuned planet we call home--as if Someone had us in mind all along.
Here is a recent podcast on the book:
Improbable Planet: How Earth Became Humanity's Home. - Frank Turek interviews Hugh Ross – Sept. 17, 2016 http://player.subsplash.com/8b92f21
Supplemental notes:
“Reason and science compels us to see what previous generations could not: that our existence is an outrageous and astonishing miracle, one so startlingly and perhaps so disturbingly miraculous that it makes any miracle like the parting of the Red Sea pale in such insignificance that it almost becomes unworthy of our consideration, as though it were something done easily by a child, half-asleep. It is something to which the most truly human response is some combination of terror and wonder, of ancient awe, and childhood joy.”  Eric Metaxas – Miracles – pages 55-56 Eric Metaxas - Does Science Argue for or against God? – (2015) video https://www.youtube.com/watch?v=UjGPHF5A6Po Linked from Appendix C from Dr. Ross's book, 'Why the Universe Is the Way It Is'; Probability Estimates for the Features Required by Various Life Forms: Excerpt: Requirements to sustain bacteria for 90 days or less: Probability for occurrence of all 501 parameters approx. 10-614 dependency factors estimate approx. 10^-303 longevity requirements estimate approx. 10^22 Probability for occurrence of all 501 parameters approx. 10^-333 Maximum possible number of life support bodies in observable universe approx. 10^22 Thus, less than 1 chance in 10^311 exists that even one such life-support body would occur anywhere in the universe without invoking divine miracles. Requirements to sustain unicellar life for three billion year: Probability for occurrence of all 676 parameters approx. 10^-859 dependency factors estimate approx. 10^-303 longevity requirements estimate approx. 10^22 Probability for occurrence of all 676 parameters approx. 10^-578 Maximum possible number of life support bodies in observable universe approx. 10^22 Thus, less than 1 chance in 10^556 exists that even one such life-support body would occur anywhere in the universe without invoking divine miracle Requirements to sustain intelligent physical life: Probability for occurrence of all 816 parameters approx. 10^-1333 dependency factors estimate approx. 10^-324 longevity requirements estimate approx. 10^45 Probability for occurrence of all 816 parameters approx. 10^-1054 Maximum possible number of life support bodies in observable universe approx. 10^22 Thus, less than 1 chance in 10^1032 exists that even one such life-support body would occur anywhere in the universe without invoking divine miracle http://www.reasons.org/files/compendium/compendium_part3.pdf
As to the stability and fine-tuning of the atmosphere in particular
A Stable Atmosphere: Another Reason Our Planet Is Special - Daniel Bakken - January 20, 2015 Excerpt: David Waltham's central argument in Lucky Planet is that the geological evidence shows the Earth has had a "surprisingly stable climate."1 There are many reasons the Earth shouldn't have one. He observes, "[O]ur beautiful, complex biosphere could never have occurred if Earth had not enjoyed billions of years of reasonably good weather."2 There are many processes that keep Earth's environment habitable, "which [in] the Earth's case may be special rather than universal."3  http://www.evolutionnews.org/2015/01/a_stable_atmosp092851.html The Cold Trap: How It Works - Michael Denton - May 10, 2014 Excerpt: As water vapor ascends in the atmosphere, it cools and condenses out, forming clouds and rain and snow and falling back to the Earth. This process becomes very intense at the so-called tropopause (17-10 km above sea level) where air temperatures reach -80°C and all remaining water in the atmosphere is frozen out. The air in the layer of the atmosphere above the troposphere in the stratosphere (extending up to 50 km above mean sea level) is absolutely dry, containing oxygen, nitrogen, some CO and the other atmospheric gases, but virtually no H2O molecules.,,, ,,,above 80-100 km, atoms and molecules are subject to intense ionizing radiation. If water ascended to this level it would be photo-dissociated into hydrogen and oxygen and, the hydrogen being very light, lost into space. Over a relatively short geological period all the water and oceans would be evaporated and the world uninhabitable.,,, Oxygen, having a boiling point of -183°C, has no such problems ascending through the tropopause cold trap into the stratosphere. As it does, it becomes subject to more and more intense ionizing radiation. However this leads,, to the formation of ozone (O3). This forms a protective layer in the atmosphere above the tropopause, perfectly placed just above the cold trap and preventing any ionizing radiation in the far UV region from reaching the H2O molecules at the tropopause and in the troposphere below. http://www.evolutionnews.org/2014/05/the_cold_trap_h085441.html
Verse and Music:
Isaiah 45:18-19 For thus says the Lord, who created the heavens, who is God, who formed the earth and made it, who established it, who did not create it in vain, who formed it to be inhabited: “I am the Lord, and there is no other. I have not spoken in secret, in a dark place of the earth; I did not say to the seed of Jacob, ‘seek me in vain’; I, the Lord speak righteousness, I declare things that are right.” Creed by Rich Mullins https://www.youtube.com/watch?v=H-61MaWETiU
bornagain77
September 23, 2016
September
09
Sep
23
23
2016
07:10 PM
7
07
10
PM
PDT
1 3 4 5

Leave a Reply