Uncommon Descent Serving The Intelligent Design Community

Interesting Graphs of US Temp & Precip History

Share
Facebook
Twitter
LinkedIn
Flipboard
Print
Email

From NOAA here

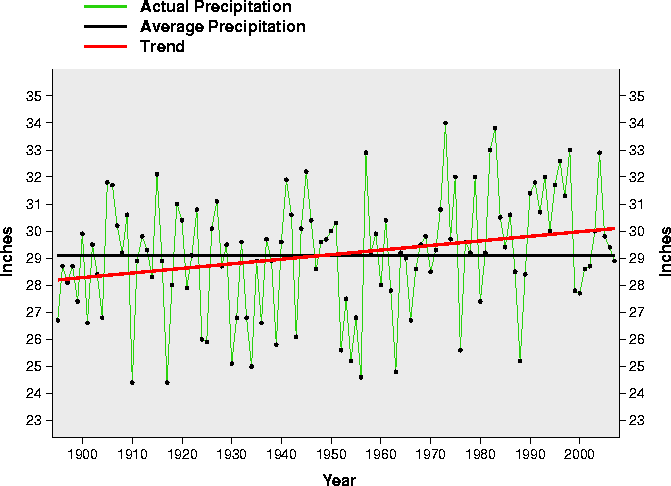
These are annual average temperature (top) and precipitation (bottom) in the United States from 1895 through 2007.

The magnitude of change in the trend lines, +1 degree in temperature, +2 inches annual rainfall, is interesting but not nearly as interesting as the slopes being almost identical and straight as an arrow. That’s an amazing correlation for there to be no direct causal factor in common. Warmer, wetter, and more CO2 are good things for agriculture. God help us all if those trend lines go towards colder and drier. If it does we’ll be inventing ways to make global warming happen.

US Temperature
US Precipitation

Comments
DLH, I respect your opinion and will try to refrain from using that word but please don't discount the possibility it may be happening. When someone uses Hollywood disaster footage without comment in a documentary to illustrate a crisis one is obliged to go hmmmmm. And when the same political alliance describes a crisis then advocates actions that would actually worsen it as per their claimed cause of it (new turnpike tollbooths, removing hydro-electric dams), I can't help but go mega-hmmmmm.tribune7
May 15, 2008
May
05
May
15
15
2008
03:13 PM
3
03
13
PM
PDT
I find this video brings a smile to my face. (Thanks to Minnesotans for global warming.)William Wallace
May 12, 2008
May
05
May
12
12
2008
07:14 PM
7
07
14
PM
PDT
tribune7 I would rather not use "lying" unless there is clear evidence to support it. See the numerous accusations as in the following Google search: Panda's thumb lying Lets set the example in origin's discourse and oppose such frivilous rhetorical use of "lying".DLH
May 12, 2008
May
05
May
12
12
2008
09:18 AM
9
09
18
AM
PDT
loltragicmishap
May 11, 2008
May
05
May
11
11
2008
06:28 PM
6
06
28
PM
PDT
They may be deluded and morally unaware of what they are doing. DLH, What evidence would you accept that they (OK, some) are lying through their teeth-- i.e. knowingly and with premeditation disseminating information that they know to be false, and --and to add to my cynicism-- for the pursuit of personal money and power? Frankly, I can't see any other word for it. Now, I grant that "they" is a rather broad term, and certainly there are those who are sincerely and passionately concerned about global warming. You can usually tell who they are because they are outspoken advocates of nuclear power. And of course there are others who are not lying but merely stupid and followers of fashion. But follow the money. To ignore that lying -- in the ugliest definition of the word-- is not being used by some in the pursuit of power and money, is naive.tribune7
May 11, 2008
May
05
May
11
11
2008
10:52 AM
10
10
52
AM
PDT
An interesting article addressing the issue is: Is the earth getting warmer, or cooler? A tale of two thermometers Are the "adjustments" by NASA's Hansen to "correct" for errors, or are they the bias that is creating "global warming"?DLH
May 11, 2008
May
05
May
11
11
2008
10:08 AM
10
10
08
AM
PDT
Next would be to show a plot of temperature vs precipitation
I did. There's no pattern, as I pointed out above, the correlation is effectively zero.Bob O'H
May 11, 2008
May
05
May
11
11
2008
08:47 AM
8
08
47
AM
PDT
Interesting trends. Next would be to show a plot of temperature vs precipitation and to do an autocorrelation to check the correlation. Major issues: Is the temperature trend biased by 1) the "heat island effect"? e.g., Parker and Fresno Airport and How not to measure temperature, part 10 Note particularly the "careful" location of the temperature sensor near concrete and an air conditioner exhaust! 2) systematic bias in temperature adjustment. e.g. see: Petaluma CA There are better analyses around, but these are a flavor to exemplify the issues.DLH
May 11, 2008
May
05
May
11
11
2008
07:54 AM
7
07
54
AM
PDT
tribune7 It is worth raising scientific criticism. However lay off the ad hominem accusation of moral perversity unless you have clear evidence to the contrary. cf your statement "To me, that is slam-dunk evidence that they are lying through their teeth about there being a crisis." They may be deluded and morally unaware of what they are doing.DLH
May 11, 2008
May
05
May
11
11
2008
07:38 AM
7
07
38
AM
PDT
I'd like to take this time to again point out that the same crowd that insist "the world is burning to the ground" wants to rip down hydro-electric dams and prohibit nuclear energy all the while having personal carbon footprints much bigger than average. To me, that is slam-dunk evidence that they are lying through their teeth about there being a crisis.tribune7
May 11, 2008
May
05
May
11
11
2008
05:48 AM
5
05
48
AM
PDT
Bob I realize the slopes will change with plot scales. I didn't pick the scales that were used. As well, if you change the period of time (for instance use 1895 to 1962) you'll find the temp trend slope to be about the same but the precip slope is flat. Conceded the straight line is an artifact of a simple linear regression across the entire time series. That has rather limited use in data presentation. A trend line in that can be extremely misleading. A single high/low reading at either end of the data series would plot a trend line that would appear as a gradual slope across the entire series when in fact there was no trend at all. I guess I was expecting the trend line to be a rolling average based on the length of time specified in the base period. Mibad.DaveScot
May 11, 2008
May
05
May
11
11
2008
05:13 AM
5
05
13
AM
PDT
...is interesting but not nearly as interesting as the slopes being almost identical and straight as an arrow.
Well, they would be "straight as an arrow" - they're tend lines, so by definition they are straight. A cubic curve actually fits the temperature data much better. It's difficult to see what you mean by the slopes being the same: the slopes on the plots are in part artifacts of the plotting: there is a lot more white (errm, grey) space around the temperature plot. If you plot them so that the data takes up the same proportion of the vertical scale, the temperature slope looks bigger. In fact, when we scale the data to the same variance, the slope for the temperature effect is about 1.7 times larger.
That’s an amazing correlation for there to be no direct causal factor in common.
The correlation in the data is actually slightly negative (-0.06).Bob O'H
May 11, 2008
May
05
May
11
11
2008
12:59 AM
12
12
59
AM
PDT
perhaps i should have said that was the 29th coolest in 114 years, but it WAS 1 degree farenheit below the 100 year average.interested
May 10, 2008
May
05
May
10
10
2008
01:17 PM
1
01
17
PM
PDT
Dave: FYI. From The Skeptic, Vol. 14 No. 1 Featured Article: A Climate of Belief, by Patrick Frank. "The following is Patrick Frank’s controversial article challenging data and climate models on global warming. Patrick Frank is a Ph.D. chemist with more than 50 peer-reviewed articles. He has previously published in Skeptic on the noble savage myth, as well as in Theology and Science on the designer universe myth and in Free Inquiry, with Thomas H. Ray, on the science is philosophy myth." http://www.skeptic.com/the_magazine/featured_articles/v14n01_climate_of_belief.html This article is pretty devastating. The maths supporting Frank's calculations can be found at http://www.skeptic.com/the_magazine/featured_articles/v14n01resources/climate_belief_supporting_info.pdf The author's conclusion: "General Circulation Models are so terribly unreliable that there is no objectively falsifiable reason to suppose any of the current warming trend is due to human-produced CO2, or that this CO2 will detectably warm the climate at all. Therefore, even if extreme events do develop because of a warming climate, there is no scientifically valid reason to attribute the cause to human-produced CO2. In the chaos of Earth's climate, there may be no discernible cause for warming. Many excellent scientists have explained all this in powerful works written to defuse the CO2 panic, but the choir sings seductively and few righteous believers seem willing to entertain disproofs."vjtorley
May 10, 2008
May
05
May
10
10
2008
01:17 PM
1
01
17
PM
PDT
and as an interesting subpoint.....this april was the coolest april in over 100 years: http://www.ncdc.noaa.gov/oa/climate/research/cag3/na.htmlinterested
May 10, 2008
May
05
May
10
10
2008
01:17 PM
1
01
17
PM
PDT
This supports climatologist Roy Spencer's thesis of "Nature's Thermostat" - that there are negative feedback phenomena that help stabilize climate. i.e., NOT positive feedback that increases the global warming from CO2.
April 19, 2008 RESEARCH UPDATES: (1) - Our latest article, "Potential Biases in Feedback Diagnosis from Observational Data: A Simple Model Description", has been accepted for publication in Journal of Climate. It uses a simple climate model to show how daily noise in the Earth's cloud cover amount can cause feedback estimates from observational data to be biased in the positive direction, making the climate system look more sensitive to manmade greenhouse gas emissions than it really is. (2) - I have asked the editor of the Bulletin of the American Meteorological Society to consider publishing a paper I have written entitled, "Evidence for Internal Radiative Forcing of Climate Change". I believe that this paper addresses the single most important issue neglected by the U.N.'s Intergovernmental Panel On Climate Change (IPCC): Natural climate variability generated within the climate system in the form of INTERNAL radiative forcing. This paper is a generalization of our paper that has just been accepted for publication in Journal of Climate, and describes how mixing up of cause and effect when observing natural climate variability can lead to the mistaken conclusion that the climate system is more sensitive to greenhouse gas emissions than it really is. It also shows that a small change in cloud cover hypothesized to occur with the El Nino/La Nina and Pacific Decadal Oscillation modes of natural climate variability can explain most of the major features of global average temperature change in the last century, including 70% of the warming trend. While this does not prove that global warming is mostly natural, it provides a quantitative mechanism for the (minority) view that global warming is mostly a manifestation of natural internal climate variability. (This paper is sure to be controversial, and it will be interesting to see how difficult it will be to get published.)
(April 19, 2008 update): I am becoming increasingly convinced that the main reason climate models produce so much global warming is because of a mixing up of cause and effect when climate researchers observe cloud and temperature variability in the real climate system. In "feedback analysis", it is always assumed that cloud variability is 100% the result of temperature variability, when in fact causation also flows in the opposite direction. Not accounting for this effect can lead to climate models built upon cause and effect assumptions which then result in the models producing too much warming.
Global Temperature Report 1988-2003.DLH
May 10, 2008
May
05
May
10
10
2008
01:06 PM
1
01
06
PM
PDT

Leave a Reply