This election in the US is at a kairos for not only the US but our civilisation. What do you think, why? (Recall, UD makes no endorsements and no “un-dorsements” either, but we are aware that the seven mountains of power and influence strongly interact with worldviews and cultural agendas raising issues of alternatives.)
So, as I am primarily a visual thinker, let’s start with:
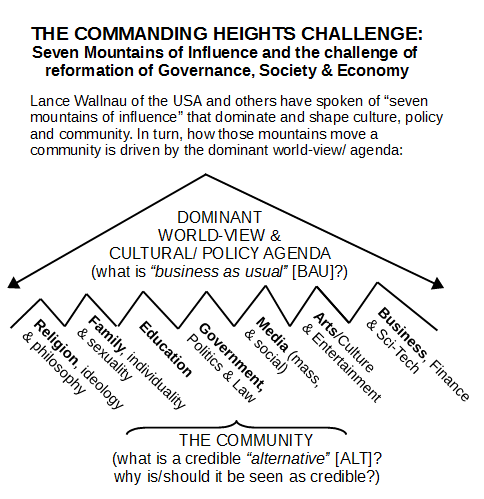
Are we facing this?
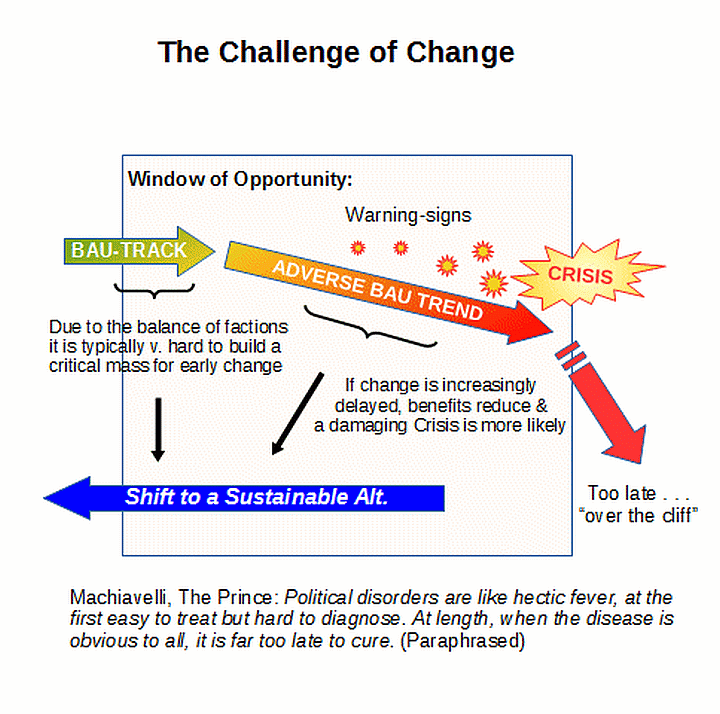
Or, is this more relevant?
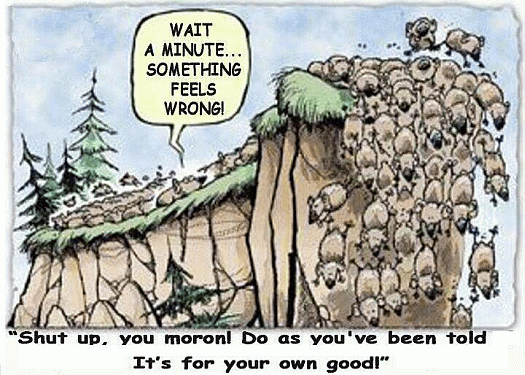
Is this colour revolution issue — courtesy a framework developed by the US Special Operations Command — relevant?
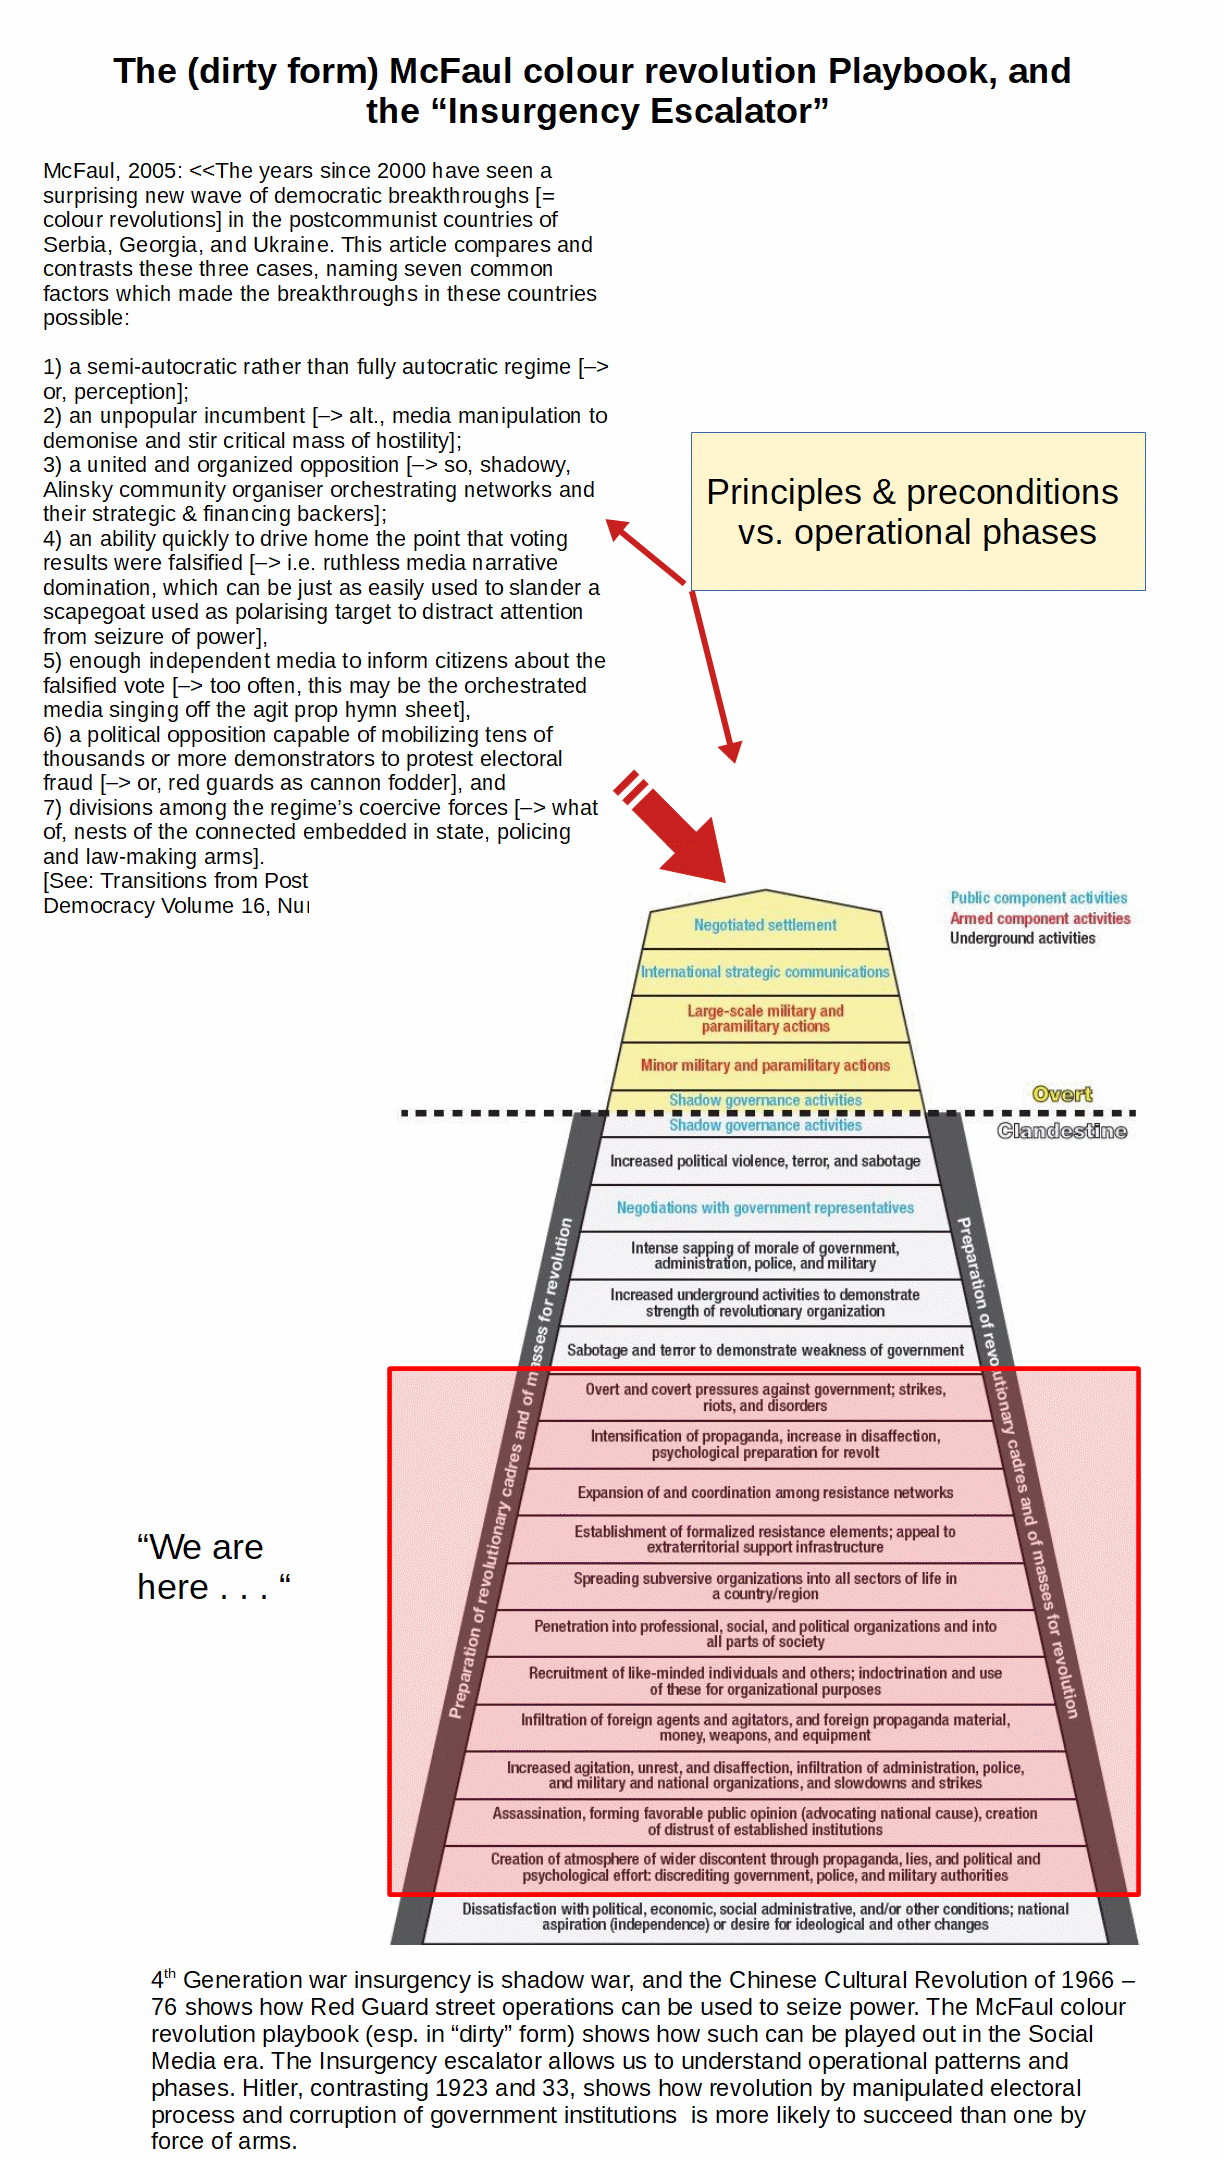
Framework of thought is always an issue:

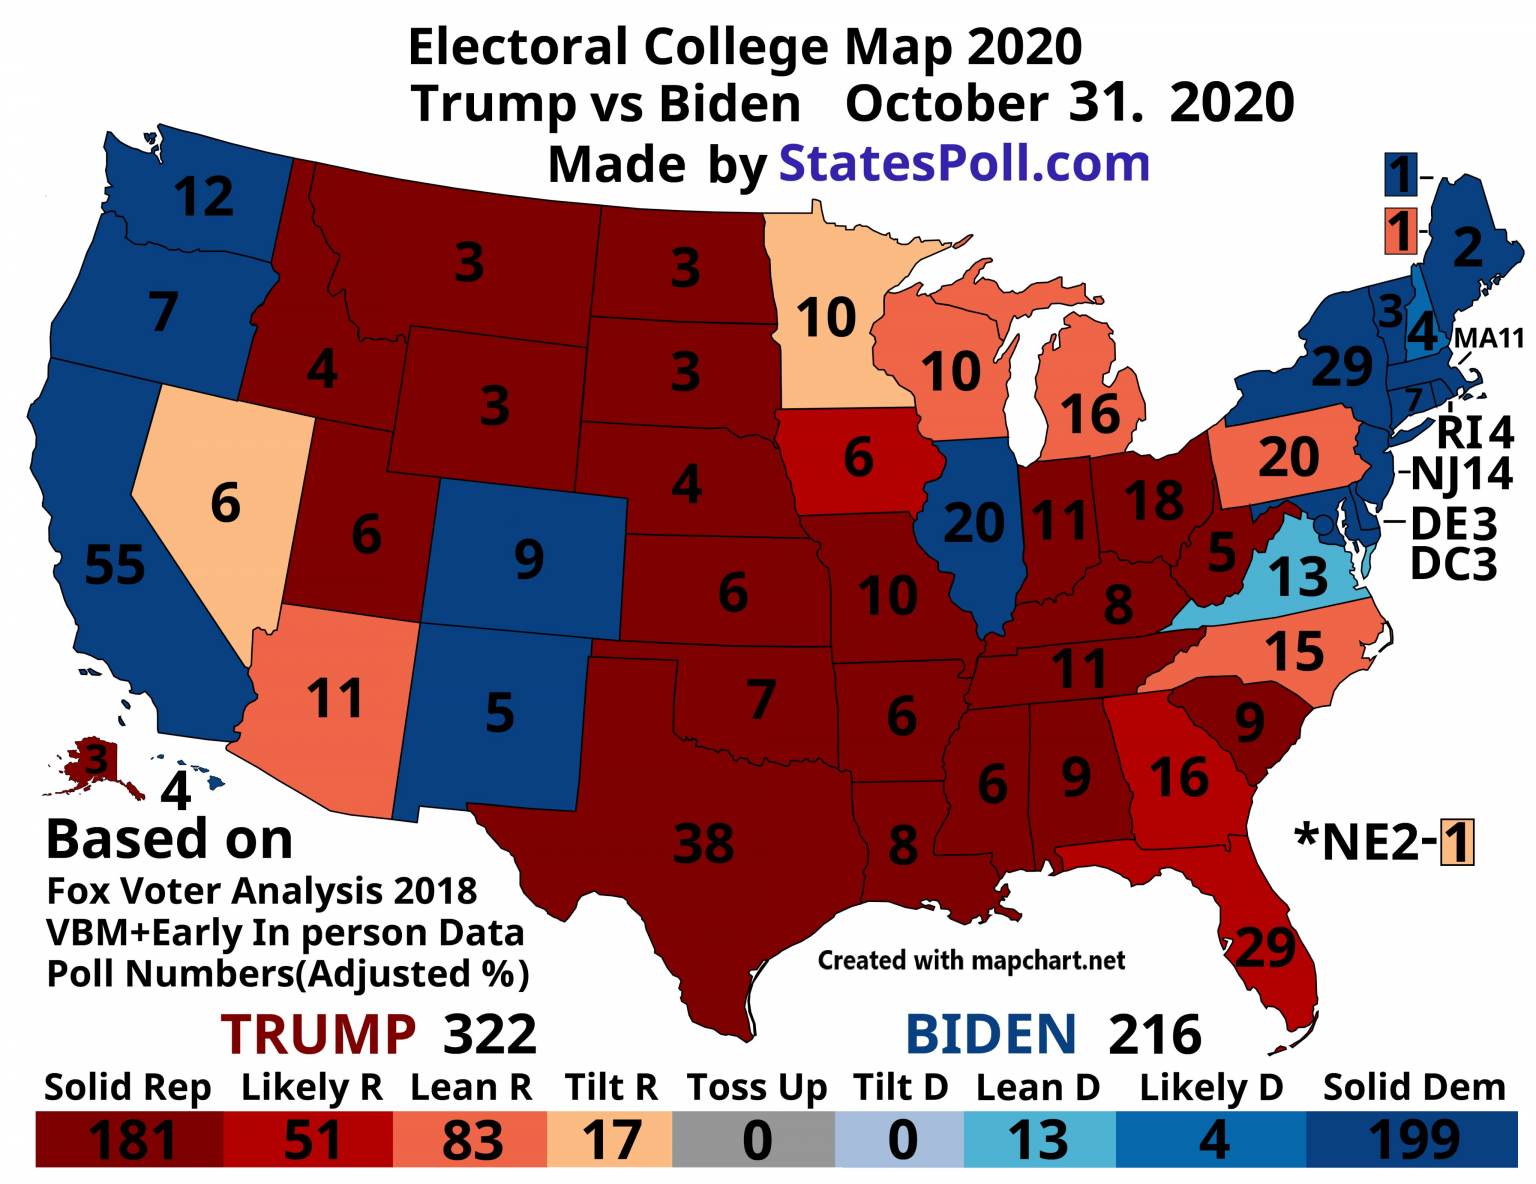
Here, is a provocative projection that runs counter to the current of the usual polling and punditry that were so spectacularly wrong in 2016:
U/D: I add a map from 270 to win:
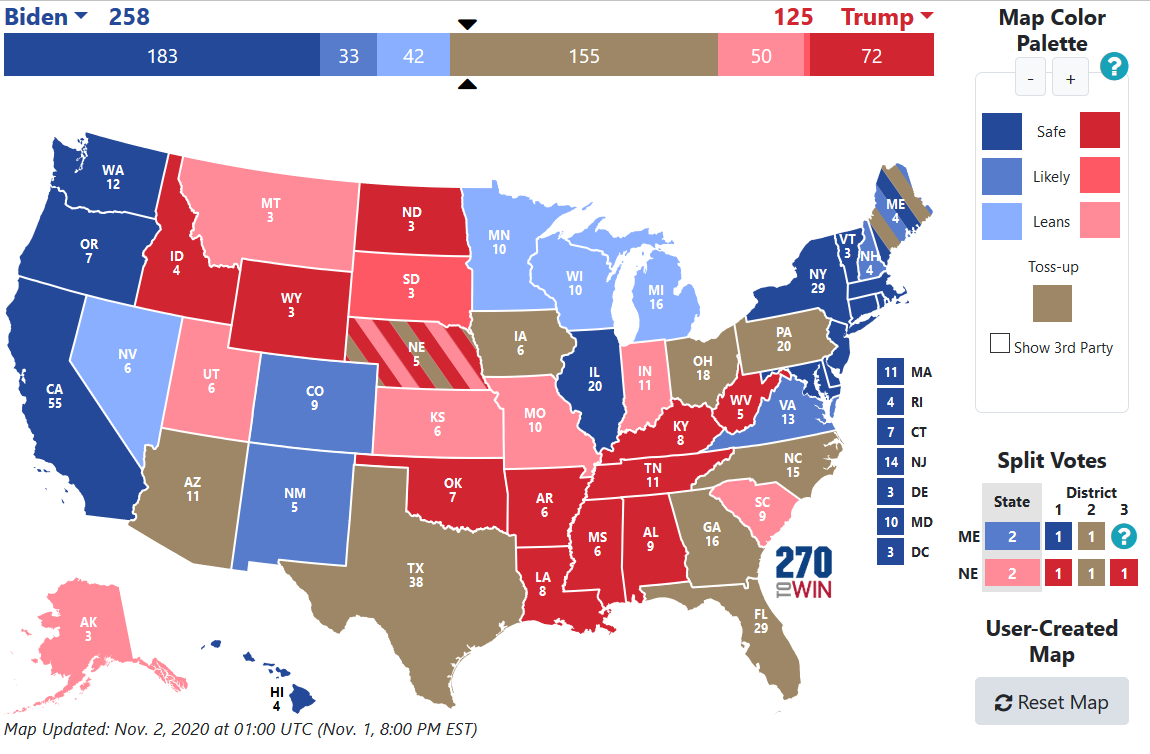
(This map has an interactive roll your own feature so you can make your own model.)
Overnight:
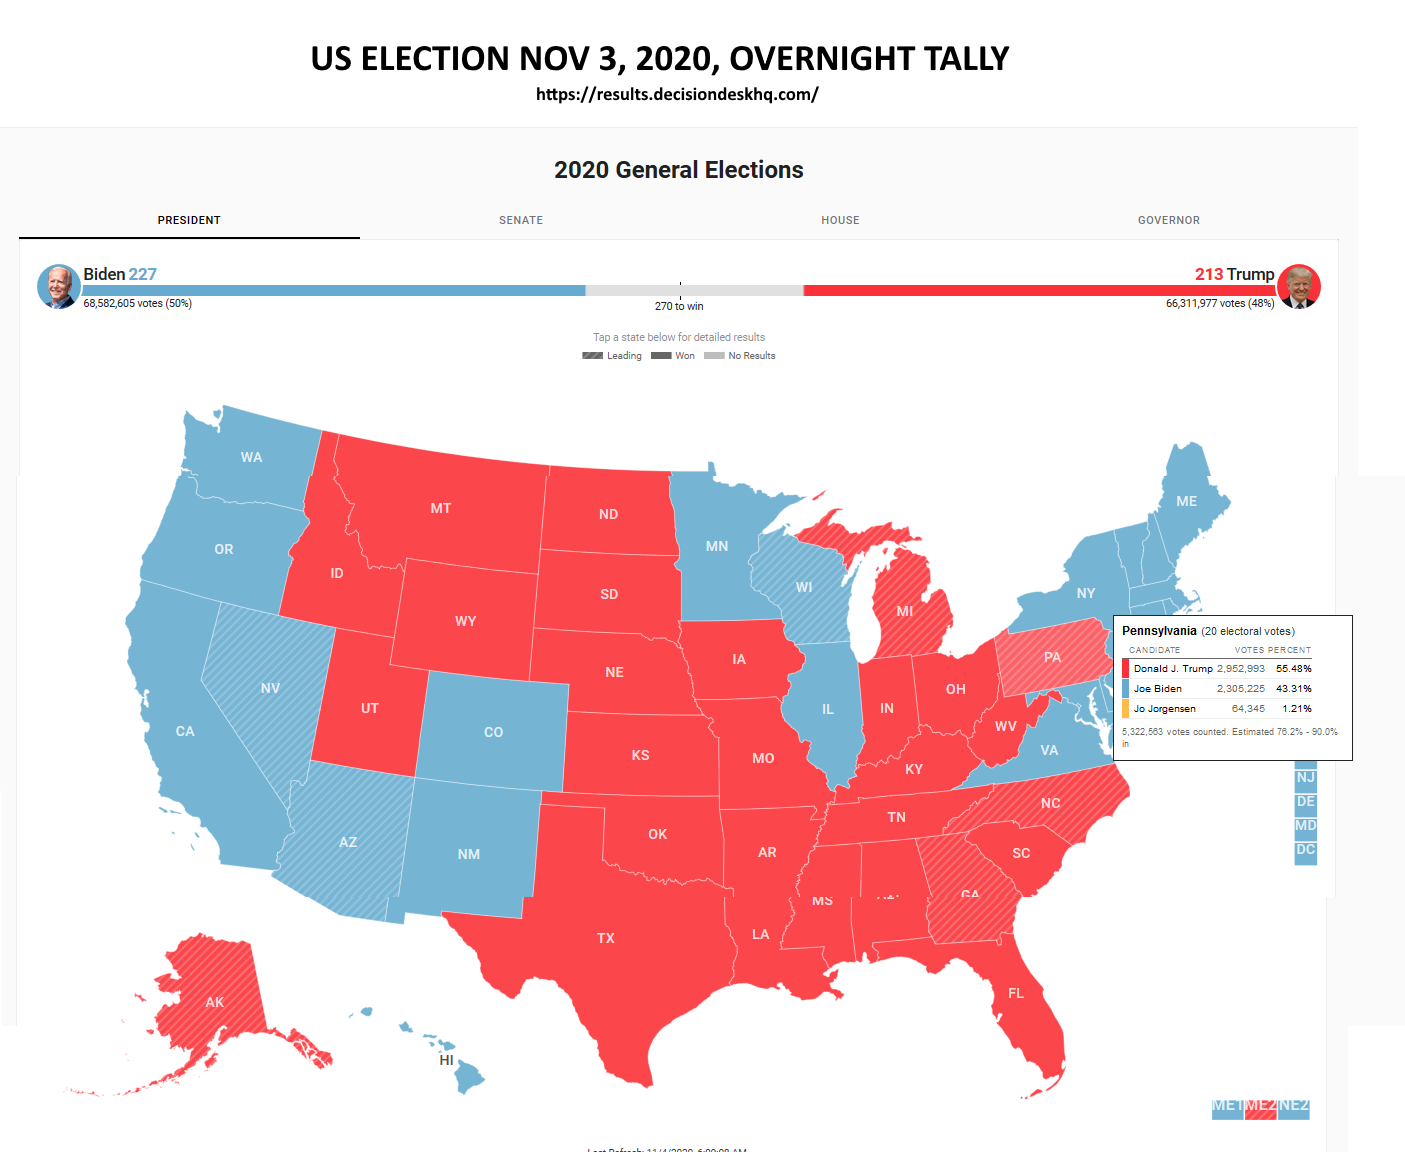
Where do we think things will go? Where are they going? Where does all of this lead? END
PS: Mr Trump’s lawyer speaks on legal actions initiated and concerns regarding breakdown of electoral integrity as the election moves to the lawfare phase:
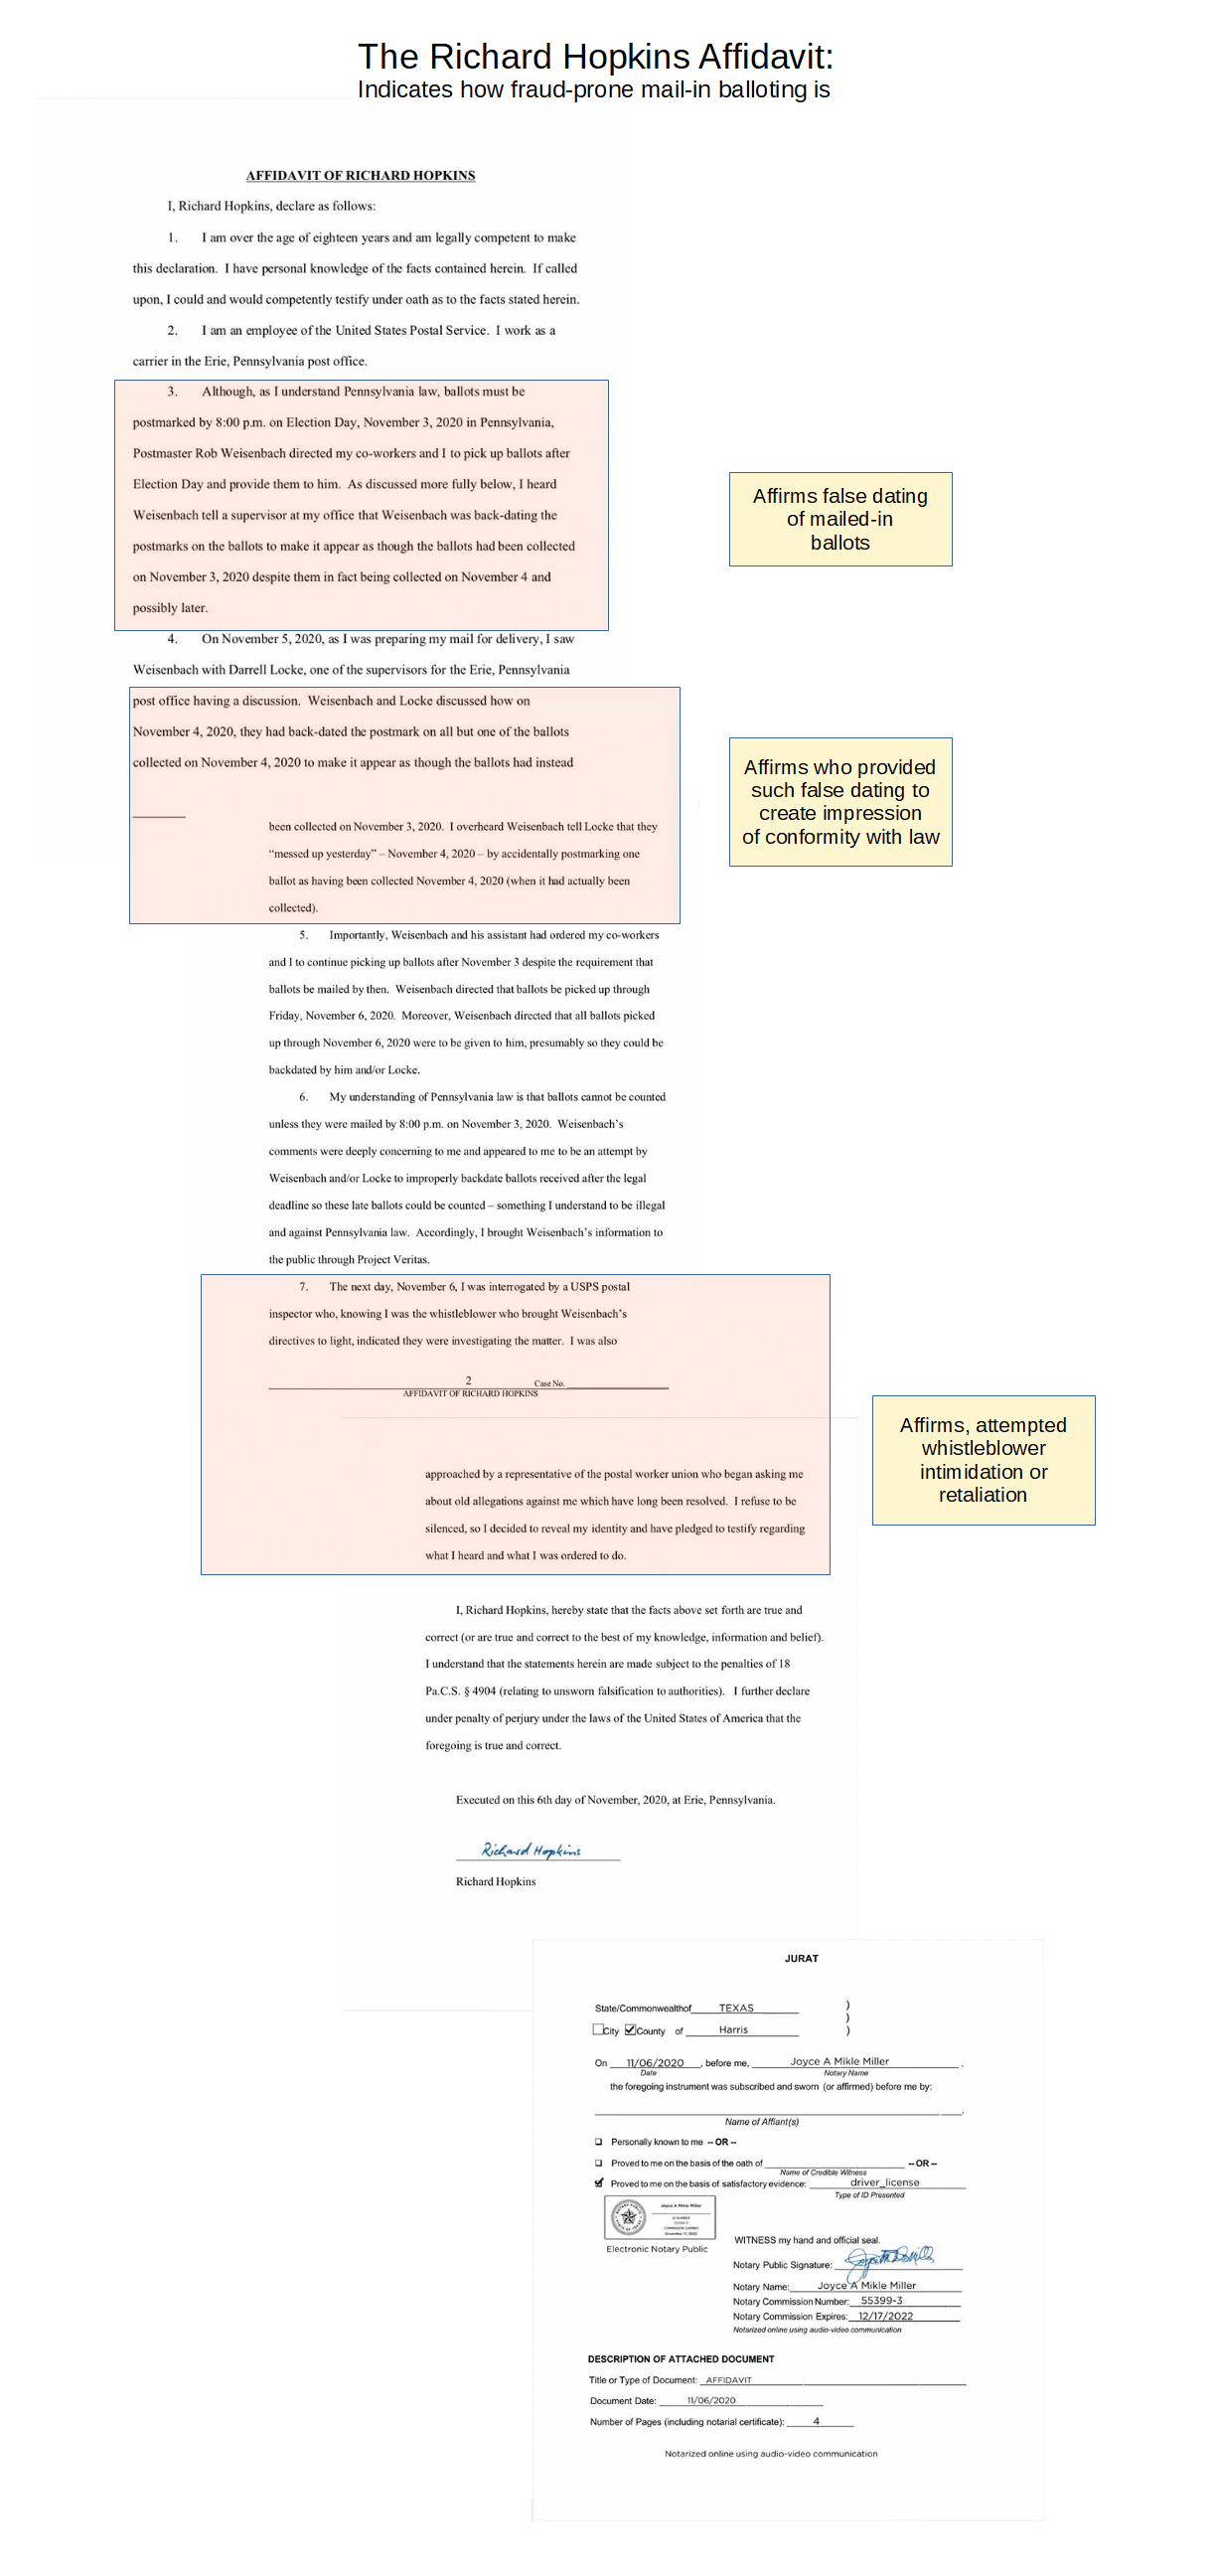
Turley raises pointed questions, contrasting the performance of states and what it opens up. Notice an incident. You do not have to believe the particulars of this claimed incident with a claimed whistleblower, to see that the fraudulent mechanism described is feasible for mail-in votes, so called. Which, should have been manifest from the outset, so the issue is why was this allowed through?
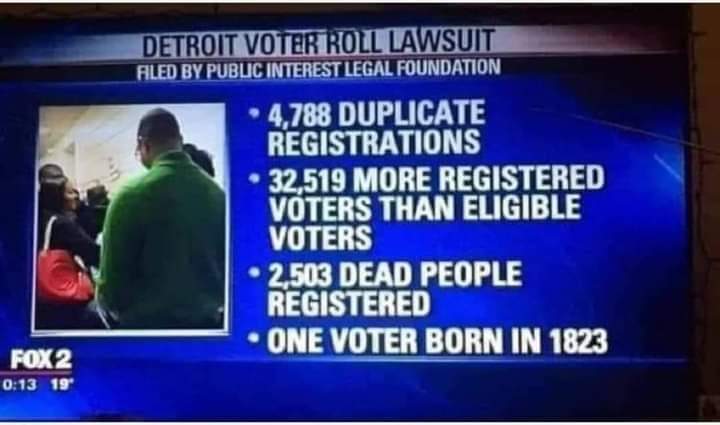
PPS: Detroit lawsuit — this would be laughable if its import was not so destructive:
U/D Nov 8: The Hopkins Affidavit
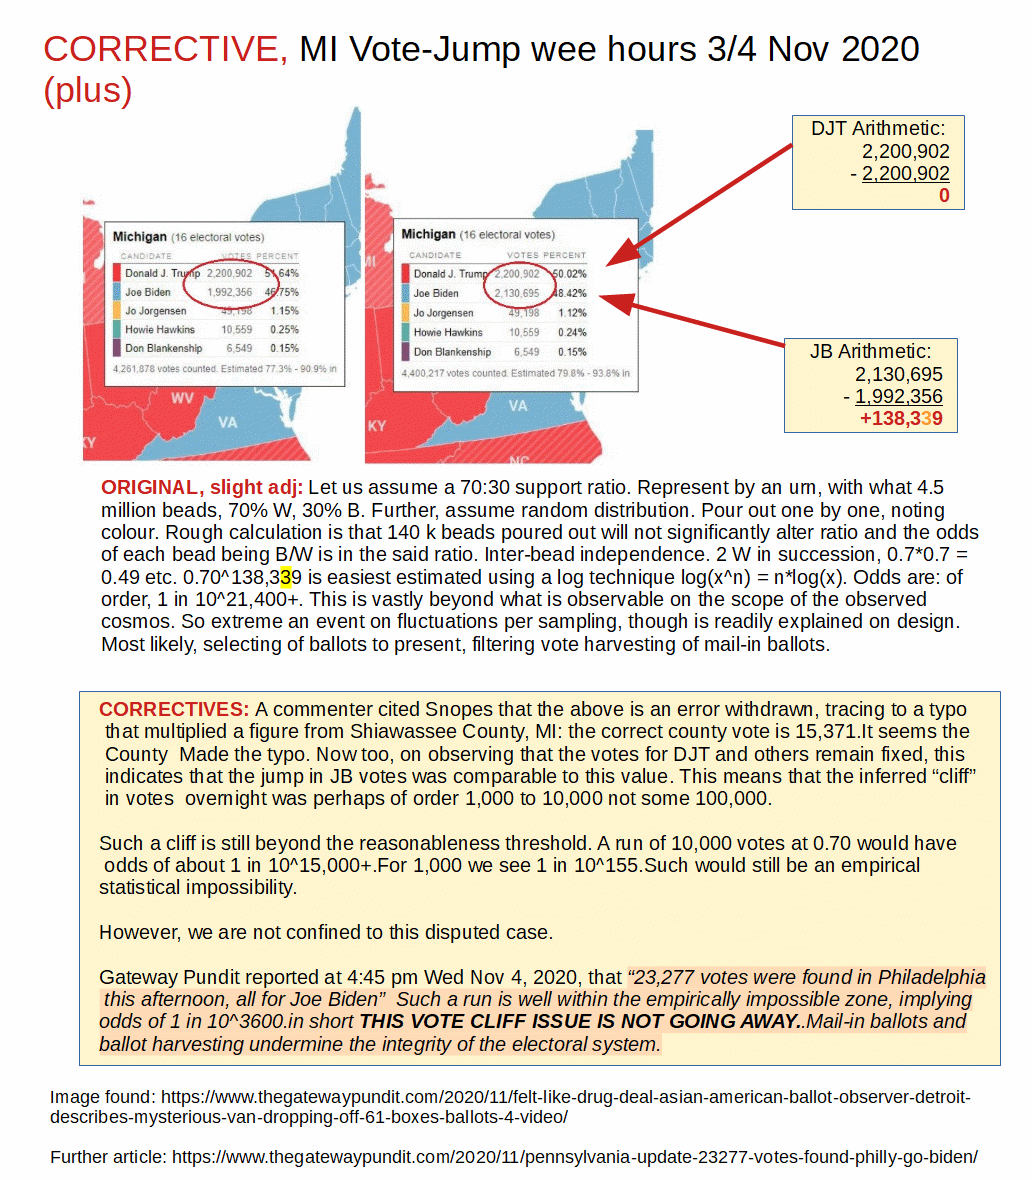
U/D2 Nov 8: An image showing the vote jump in MI overnight Nov3/4 2020, which — 5:45 pm here — on an objection from MMT apparently rooted in Snopes; which I find to be partially correct but still missing the key issue, I adjust as follows:
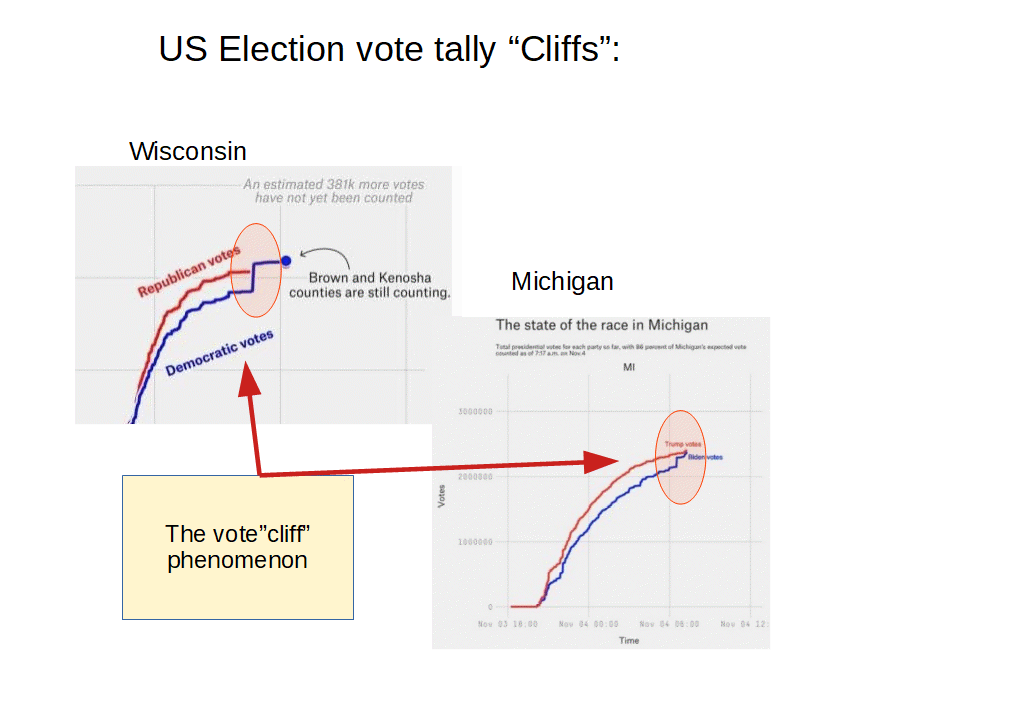
U/D3, Nov 8: The vote cliff phenomenon:
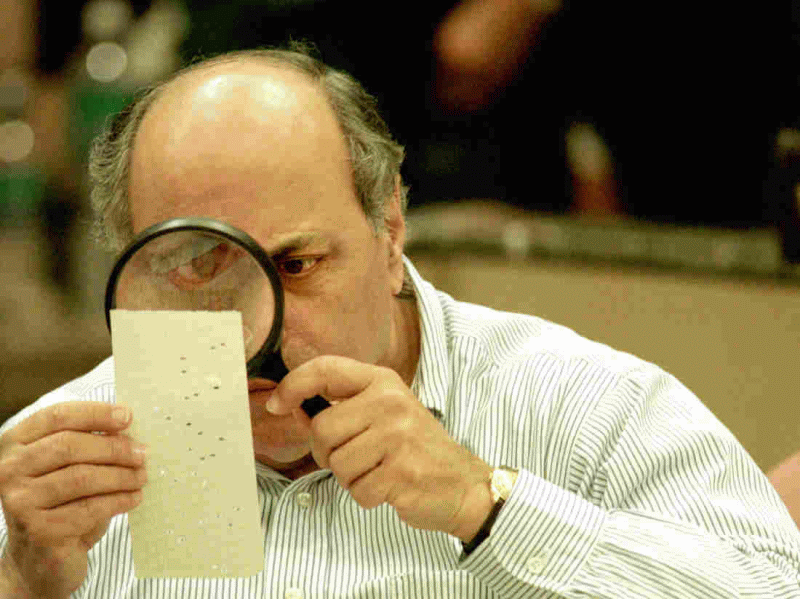
U/D4 Nov 9: A reminder from 2000, a screen shot of the last media called election fiasco:
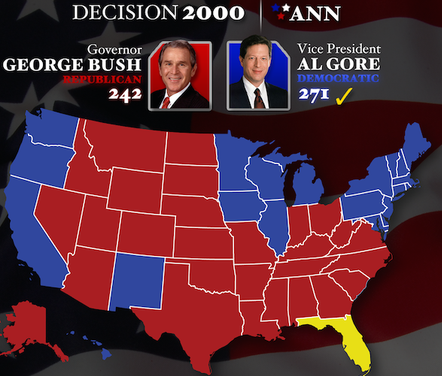
CORRECTION AND COMMENT, Nov 10: On Google image search, I observed a Wa Po article on this image. It is plausible that it is a current construction, with particulars that have errors. That said, such makes no material difference to the focal point, as can be seen from my clip of History dot com, at 477 below:
After a wild election night on November 7, 2000, during which TV networks first called the key state of Florida for Gore, [–> got that? {I add: FL was then pivotal — notice, “the key state” — so calling that state implied a Gore win}] then for Bush, followed by a concession by Gore that was soon rescinded [–> got that too?], the results for who would be the nation’s 43rd president were simply too close to call.
In the 36 days that followed, Americans learned Gore had won the popular vote by 543,895 votes. But it’s winning the Electoral College that counts. [–> because it balances big and small state interests in a federated republic that is a union of states in their own right not mere provinces of a unitary state] As accusations of fraud and voter suppression, calls for recounts and the filing of lawsuits ensued, the terms “hanging chads,” “dimpled chads” and “pregnant chads” became part of the lexicon. [–> I forgot the pregnant chads one]
Andrew E. Busch, professor of government at Claremont McKenna College and co-author of The Perfect Tie: The True Story of the 2000 Presidential Election, says as votes were counted and Bush’s lead grew, TV networks retracted their premature call of Gore, instead giving the state to Bush.
“When the lead shrank to about 2,000 votes in the early hours of the morning, TV reversed again, rescinded the call for Bush, and declared Florida as yet undetermined,” he says. “The initial problem was failure of the exit polls, for which they later overcompensated.”
U/D5, Nov 9: The Chinese observer in Detroit’s testimony on what she saw:
U/D6, Nov 9: Trump Campaign spokespeople make first remarks about their case, with particular focus on PA, also with further remarks on TCF, Detroit MI (where the above observer discussed). This includes Ms McEnany on the general manipulation of elections and this one:
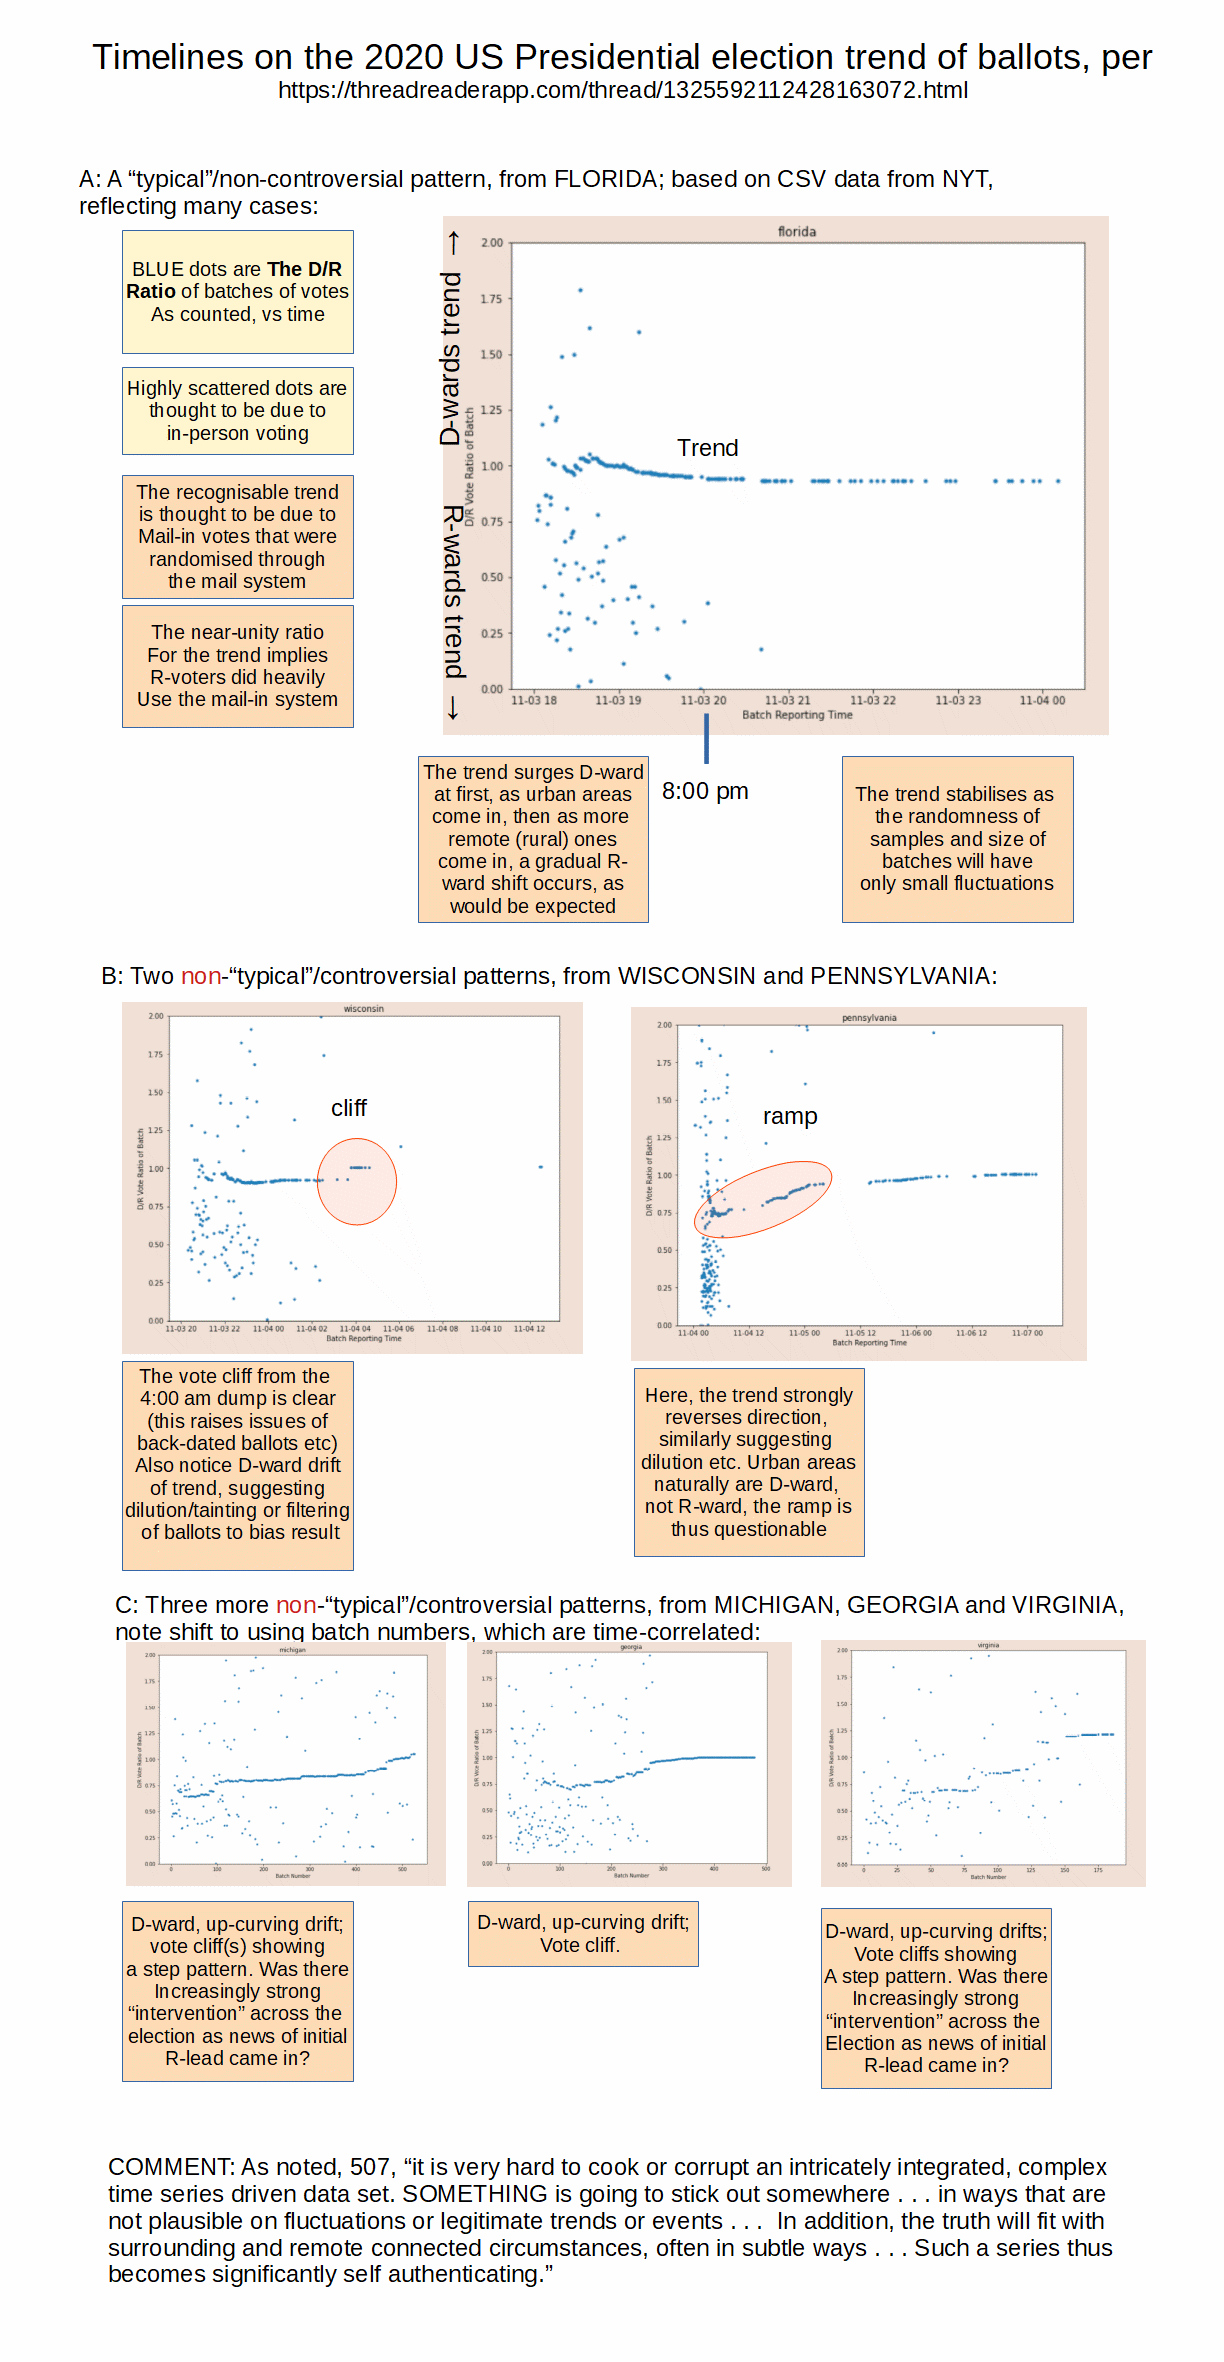
U/D7, Nov 10: Timeline plots of vote trends that support concerns that Mail-in votes were conducive to and seem to have enabled manipulation of results in key states. Obviously, it is the courts that will resolve legal cases, but it is the watching public’s right to look and analyse for ourselves, drawing our own conclusions:
It is well worth noting, from an article on how the insistence on mail-in votes with inadequate safeguards and the rise of ballot harvesting were conducive to undermining the credibility and integrity of the election:
. . . the record reveals a Democrat Party that has fervently pursued policies to undermine accountability in the voting process.
Under these resulting novel conditions, which have been implemented across the nation in recent months, no less than Supreme Court Justice Samuel Alito affirmed last week that “serious post-election problems” were predictable.
Indeed, Attorney General Bill Barr sounded the alarm in September, affirming to Wolf Blitzer of CNN that the mail-in voting schemes being advanced across the nation are “reckless and dangerous,” and “as a matter of logic,” are “very open to fraud and coercion.” He cited a 2009 bipartisan study that affirmed his points, adding this understanding was broadly accepted until “this (Trump) administration came in.”
In the face of well-documented cases of election fraud, Heritage Foundation senior fellow Hans A. von Spakovsky has also charged “many in the media” with wishing to avoid the heavy reality of this fundamental issue with a “‘move-along, nothing-to-see-here’ narrative” . . . .
In May, House Speaker Nancy Pelosi, D-California, stated her desire that “governing bodies … send a ballot to every registered voter,” and Senate Minority Leader Chuck Schumer, D-New York, affirmed he was “all in” on the plan for this enterprise as well.
When Democrat Gov. Gavin Newsom mandated that “every Californian” should be sent “a mail-in ballot for (the) November election,” Hillary Clinton praised him, encouraging “other governors around the country to follow (his) lead.”
An investigation of these efforts at the state level reveals the same urgency and insistence to adopt policies that will naturally create conditions where there are greater vulnerabilities for fraud . . . .
Michigan
Michigan has a typical state law that sought to prevent “ballot harvesting,” the practice of individuals collecting multiple ballots from the vulnerable, such as the elderly, often through coercion or intimidation, and potentially discarding them. Thus, according to statute, only particular individuals, such as family, friends, and mail carriers, may transmit a person’s absentee ballot to the appropriate clerk.
In September, after a challenge by left-leaning organizations in the state, a Michigan judge overruled these safeguards, calling them “unconstitutional” and allowing voters to “choose” anyone to return their ballots. The judge also ruled that any ballot postmarked by November 2 would be valid no matter when it arrived.
Such patterns of behaviour, including by judges, raise significant concerns. Would the same judge accept loosening of safeguards on how a run of the mill coop bank handles cash and accounts? The question answers itself.
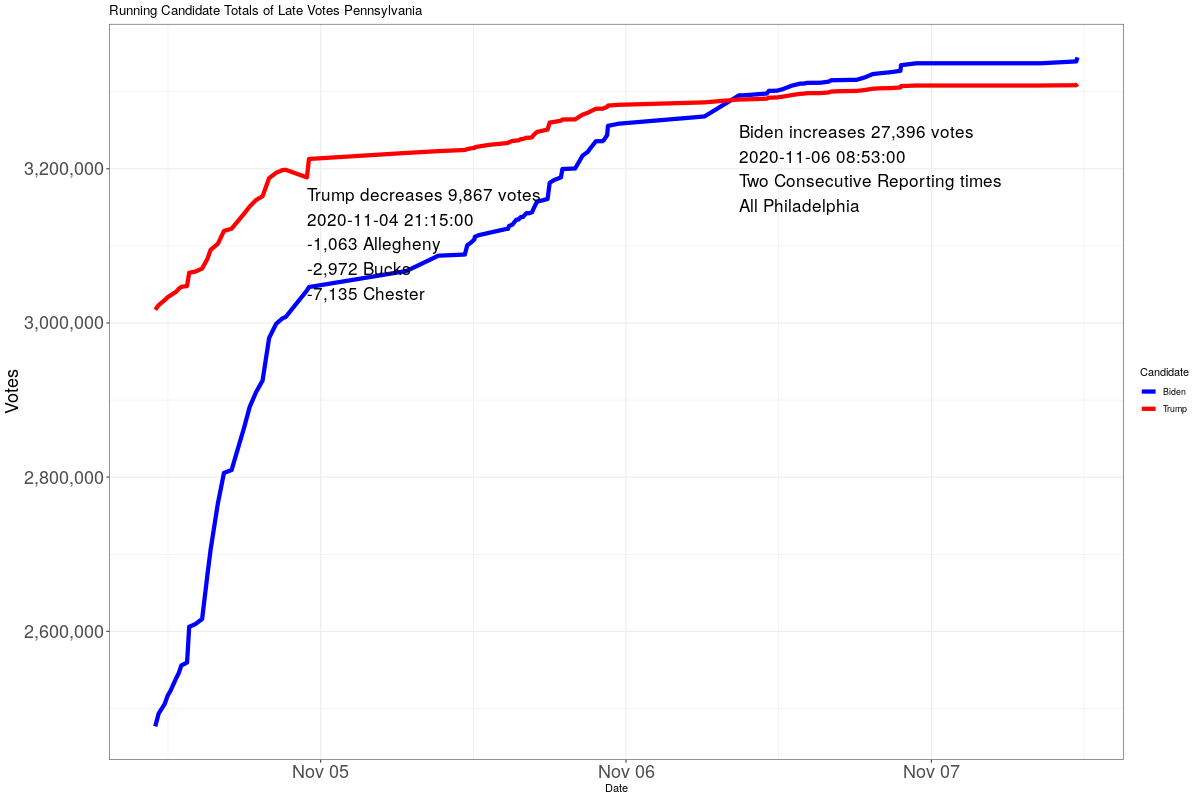
U/D8, Nov 11 (Armistice Day + 102 years): Let us ponder a further timeline, counting of late votes in PA reported by statistician William Briggs:
Here, key comments:
I think there are clear signs that something untoward happened in the Keystone State. Here are a couple of telling examples.
I’ve gotten official county-level timed voting data that started at 11:00 on November 4, the day after the election, to 11:29 on November 7, which is Saturday. So, these are all late vote counts. They start, county by county, where the vote left off on election night . . . .
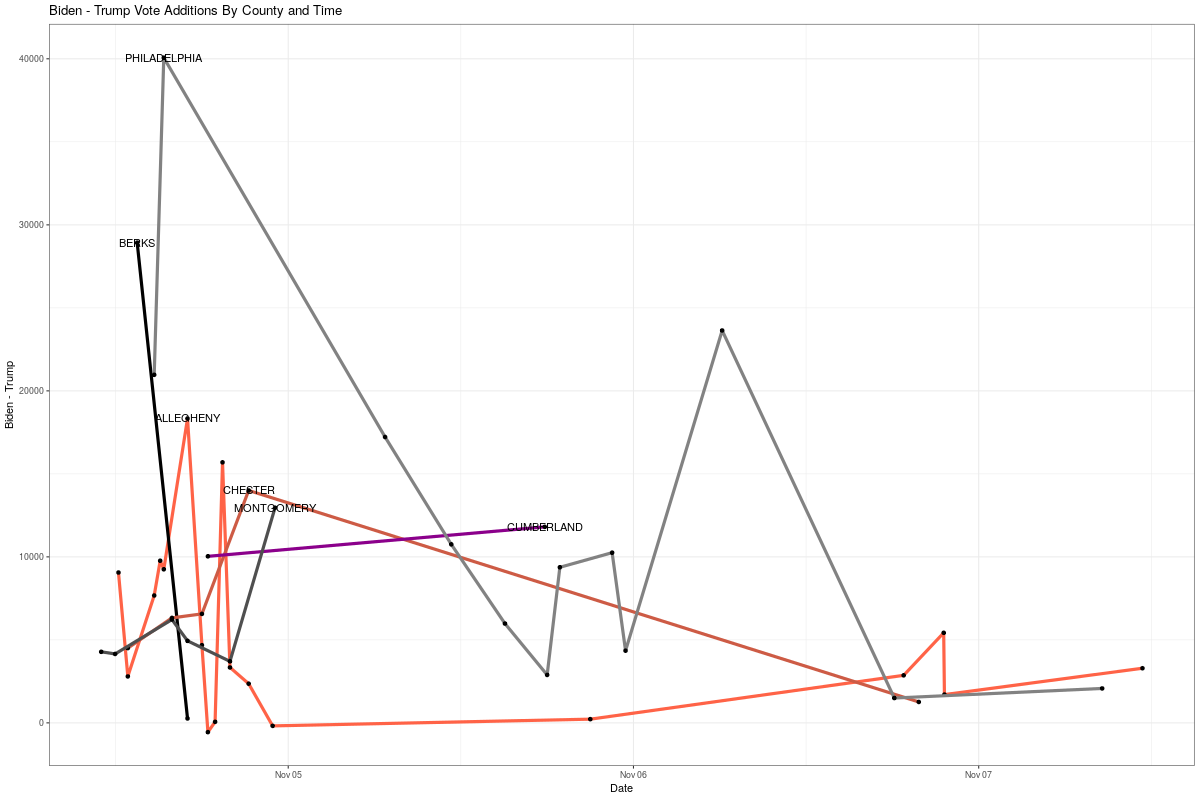
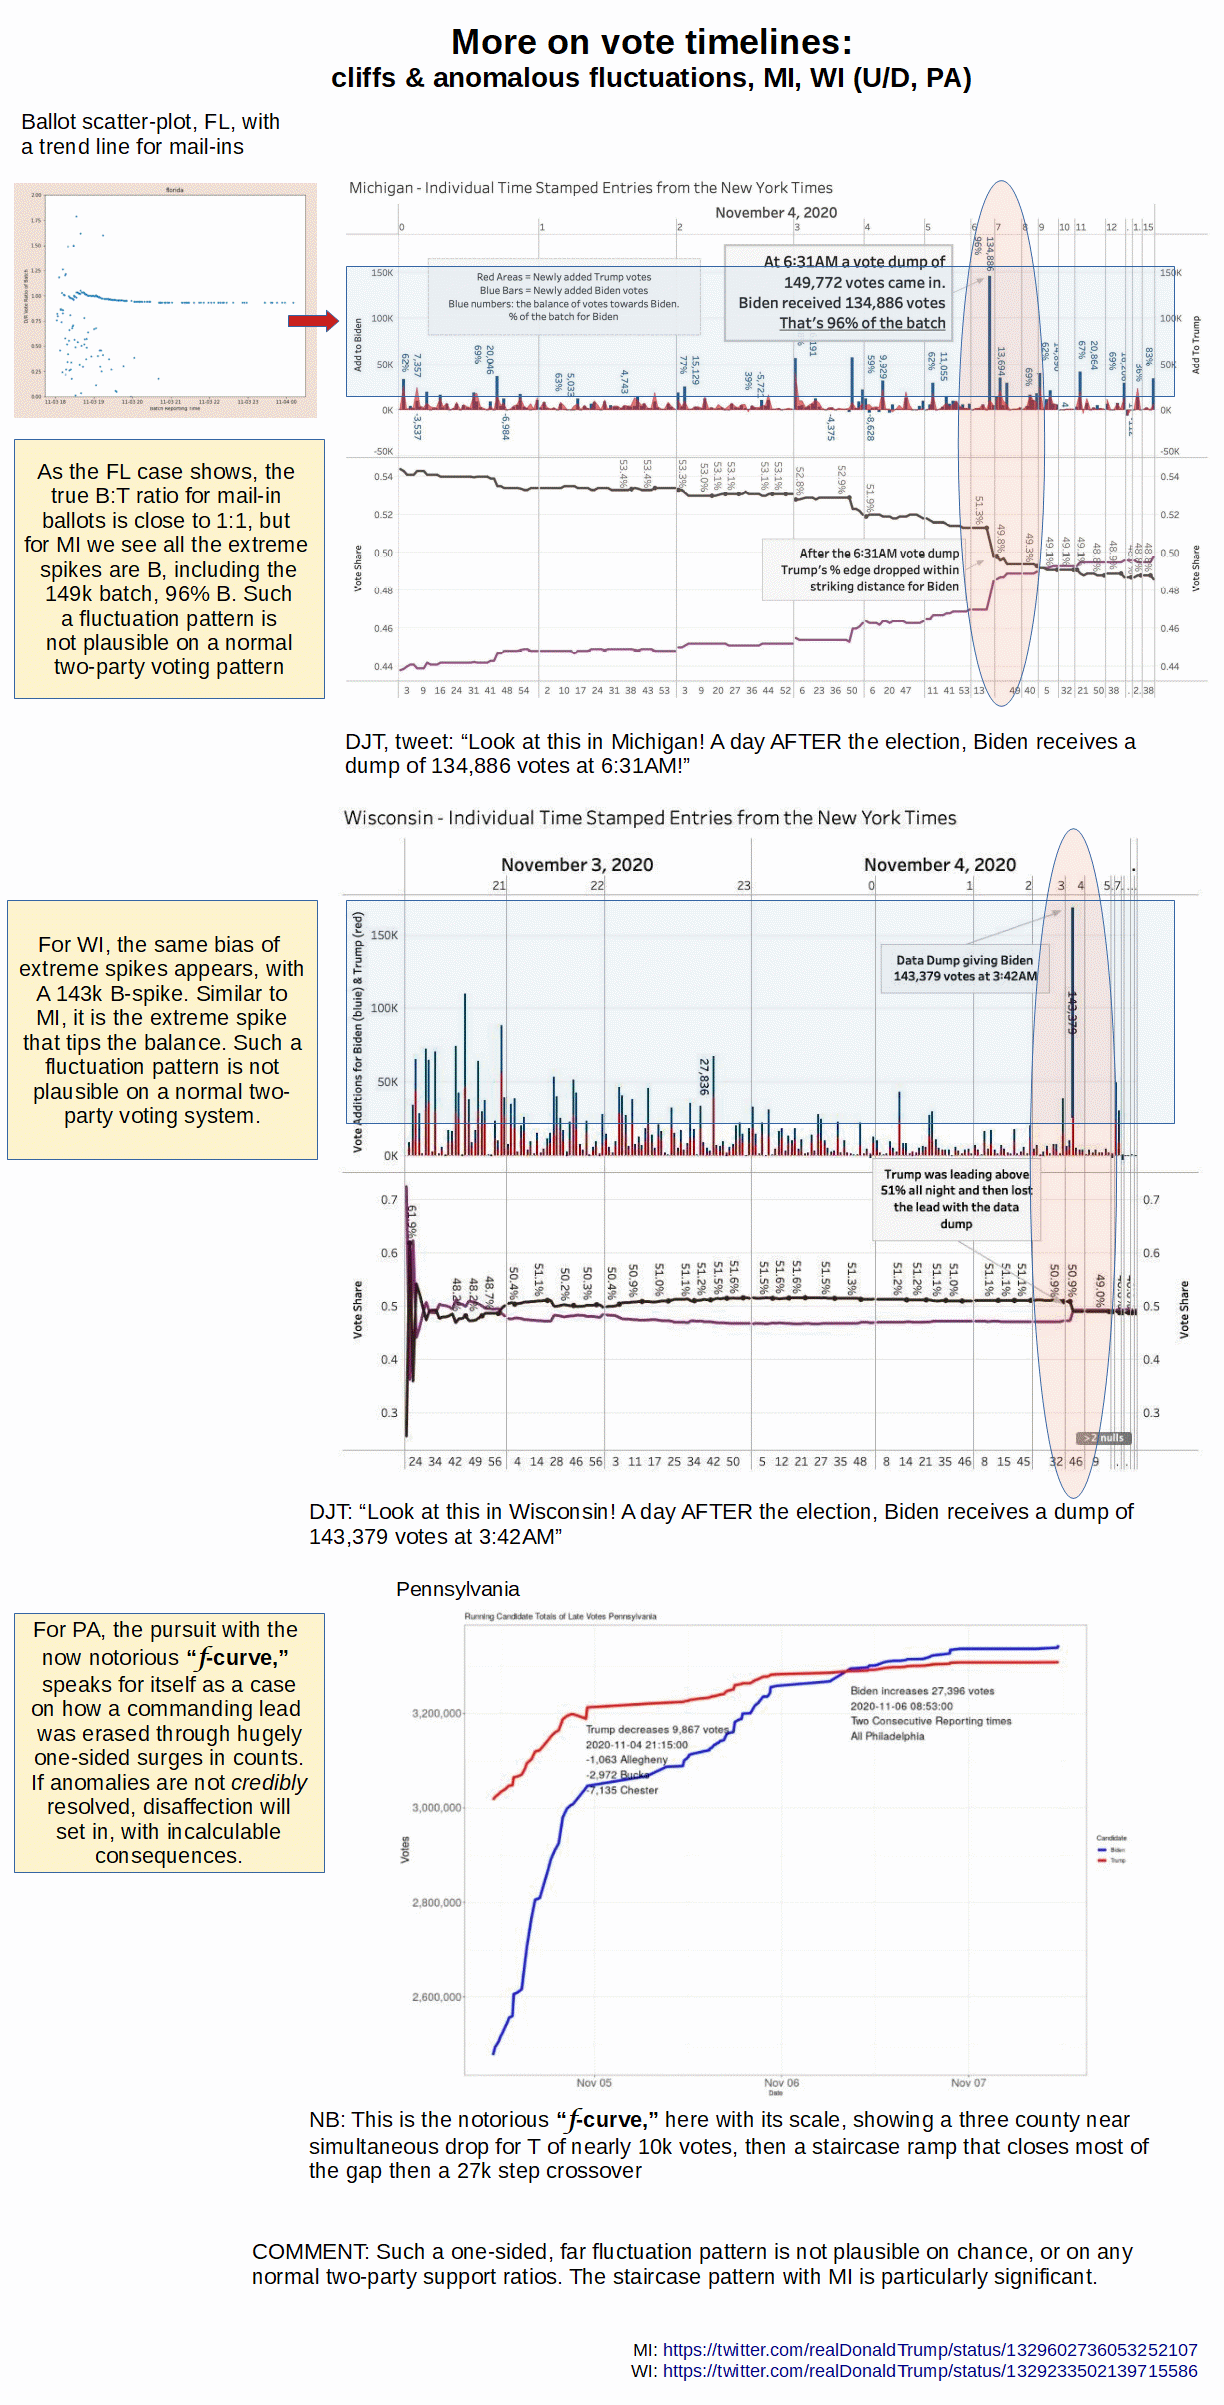
The early gains for Biden are mainly from Philadelphia, Allegheny, Montgomery, Chester and Berks counties. A simple plot (click to see: it’s large) shows the size of vote additions for both candidates, when new vote totals (greater than 0) were added by county (and not all counties added votes after election day).
All goes well for Trump until election night, November 4, at 9:15 pm, when he loses just under 10,000 votes. Curiously, this loss is from three different counties simultaneously: -1,063 in Allegheny; -2,972 in Bucks; -7,135 in Chester. Biden never lost any votes (at least, not in this late voting).
This does not mean the decreases happened at that moment. Rather, that’s when they were recorded in the official data.
Biden’s next curiosity was the big increase of 27,396 votes on Nov. 6 at 8:53:00 over one consecutive reporting period. This bump is just like the blue-red F-memes you have seen: this only seems more spread out because of the finer time scale used . . . .
These two curiosities account for a 37,263 vote swing for Biden. Biden’s total, as of the end of this data, was 3,344,528, and Trump’s 3,310,326. Biden therefore “won,” in this dataset anyway, by 34,202 votes.
So, three separate counties removed about 10,000 votes from Trump on Wednesday evening. And then late Friday, about 27,000 votes were added for Biden.
This happened after it was clear that this is what Biden would need to push ahead. This needs to be answered.
Then, he went on to look at scale of disparity from 50:50, modified by size of increments, vert: number of votes, Horiz, an index. Blue, B predominates, red, T predominates:
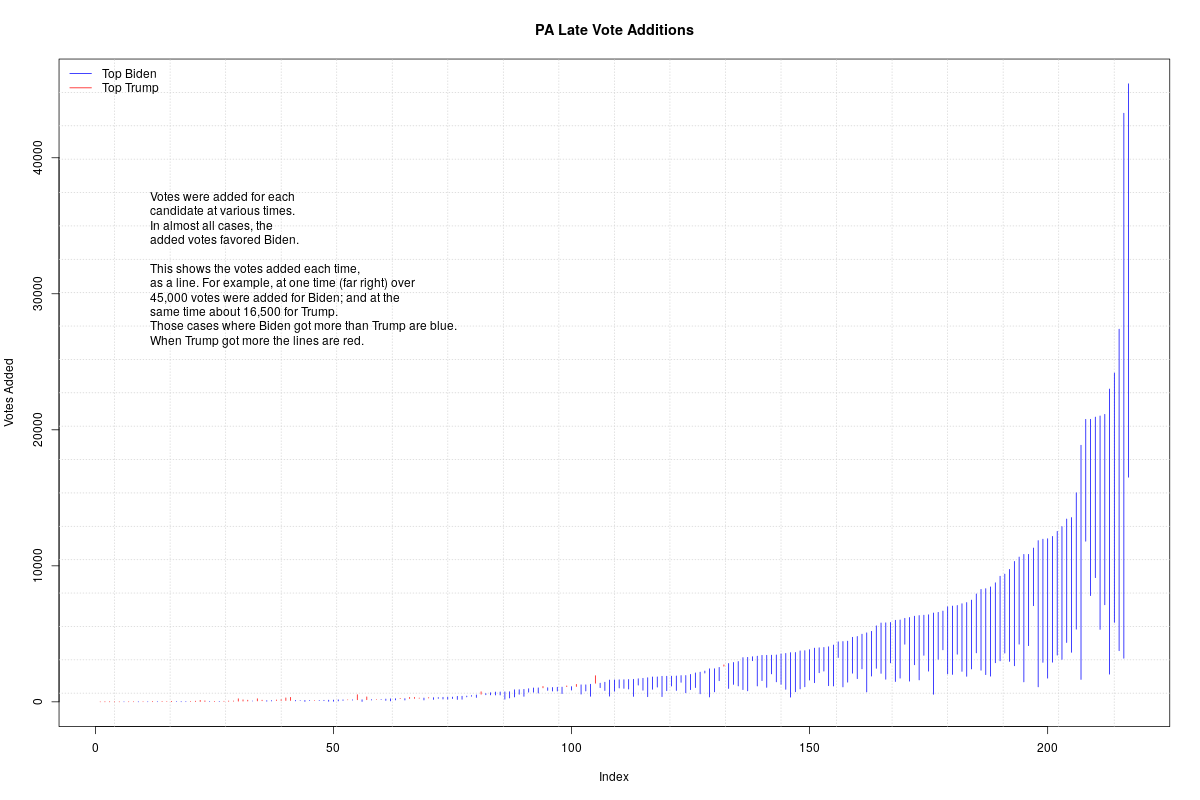
Yes, there are some where T predominates, down in the weeds, the biggest I spot is a bit over 100. Briggs comments:
Trump did come out ahead in the vote additions sometimes, but every single one of the competitions was trivial.[–> this fits with fluctuations with small numbers] They were on the order of 1 vote for Trump, 0 for Biden, or 20 for Trump and 7 for Biden. On the other hand, Biden votes additions were almost always large compared to Trump’s. (But, note: There aren’t any large times where only Biden gained votes. It’s not that obvious.) [–> note the charts for yesterday, PA shows a RAMP, not cliffs and steps]
Still, the huge early additions to Biden are curious.
He continues, commenting on a third plot:
Here are the Biden-Trump additions as they occurred, for six counties which for other reasons appear suspicious. Chester and Cumberland had predominately registered Republicans, and yet Biden supposedly beat Obama (in either term) in vote totals by 20-40%! [–> remember, nationally, T gained 7 mn votes over 2016] The county names appear at the peak of the differences. For example, late on November 4th, Biden received about 40,000 more votes than Trump in Philadelphia county . . .
That peak for Philly on the 6th is the one that pushed Biden ahead, which I mentioned above. You can see in these large counties only one time where more Trump than Biden votes were added, and it’s a trivial amount.
This suggests, as you might expect in a machine town saturated in a history of vote tampering, that investigators should concentrate their efforts on the mail-in ballots in Philly.
The plot:
Which is, of course, a key part of the reason for Justice Alito’s follow up order to preserve such separately when it became clear an earlier order was being flouted.
Bonus, this analysis corroborates the earlier one which showed a RAMP, not cliffs, for PA.
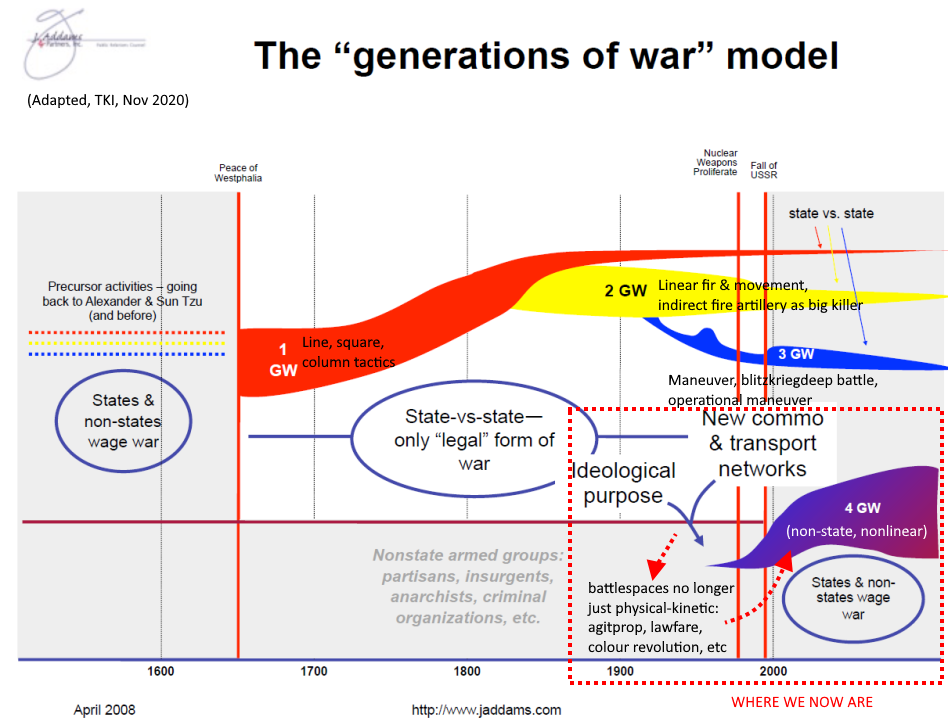
U/D9, Nov 12: A bit of context on 4th Generation war:
First, let us note a mapping framework, to help set the context, timeline and concepts:
Compare, the McFaul-SOCOM colour revolution programme and insurgency escalator (and yes, I know this uses the same image twice, for clarity):

I clip a Wikipedia summary of 4GW elements, on principle of admission against ideological interest:
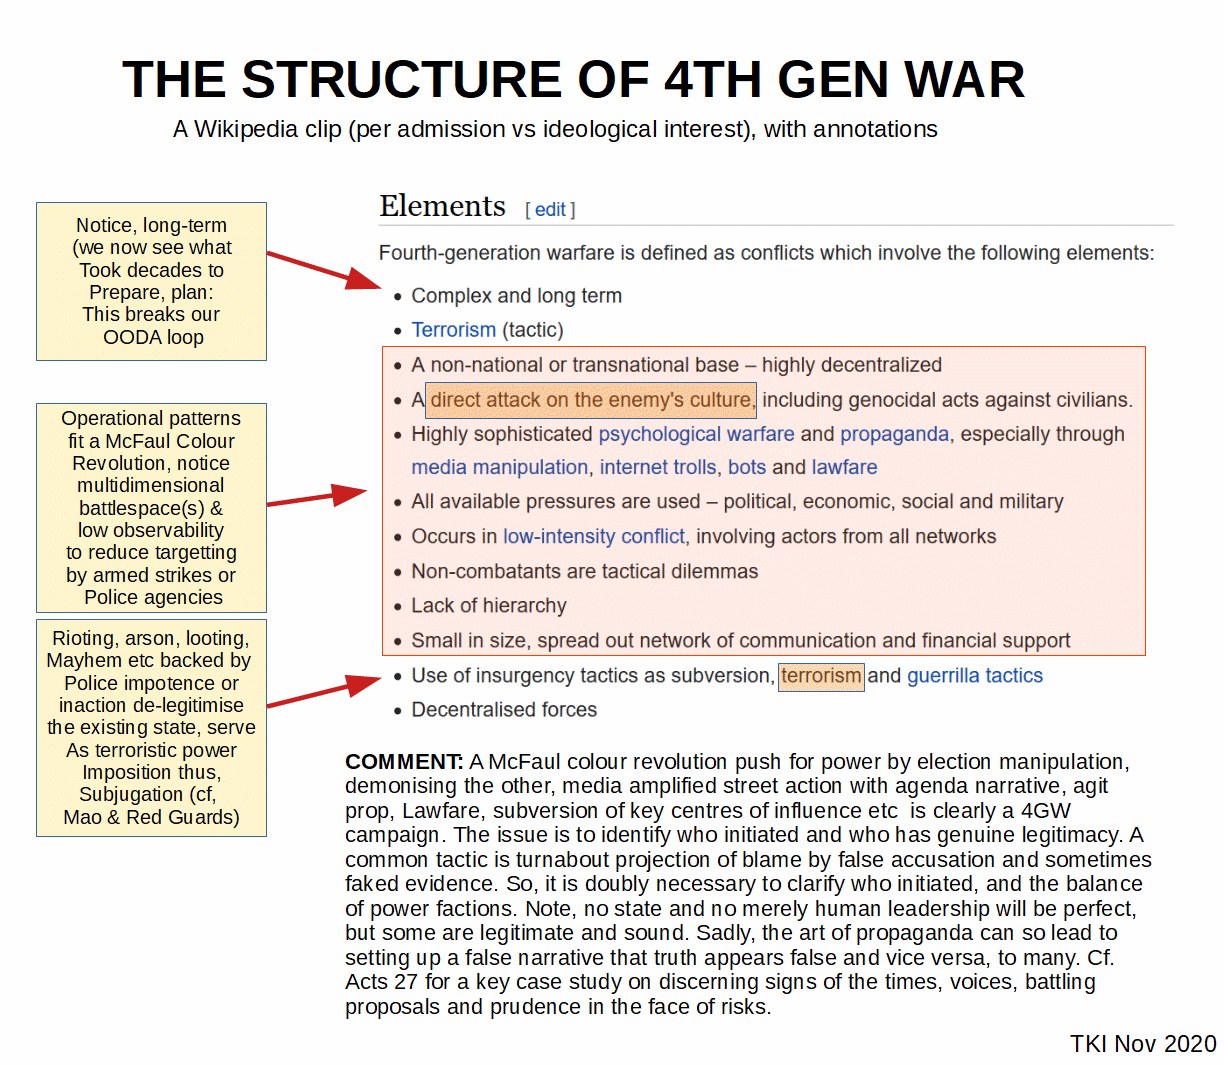
This will allow us to form a sounder strategic-operational picture of what is happening in the US with its years-in-the-brewing, McFaul colour revolution, in the shadows 4G civil war with global geostrategic implications and vultures circling as well as some lurking in the shadows.
U/D10, on the Benford leading digit(s) pattern:
One of the oddities of life is that naturally occurring most significant digits of numbers for many “natural” situations, do not follow a flat random distribution or a humped in the middle pattern, but a reverse-J distribution, with about 30% of cases having 1 as lead digit, with a following curved taper to 9. The phenomenon is sufficiently striking that it has been used to detect accounting fraud, cooking of GDP data and even cooking of CV-19 data. It has also been used to detect election manipulation . . . including a case of too perfect fit implying second order manipulation to force the cheat to fit the “known” law. At 636 below, I commented:
Let’s pick up on “natural” distributions of numbers and the now notorious Benford pattern natural data signature, 1 as lead digit about 30% of the time, with a curved taper distribution of other lead digits, to 9. Of course, a statistical pattern, not a rigid rule, but then fluctuations kick in . . . .
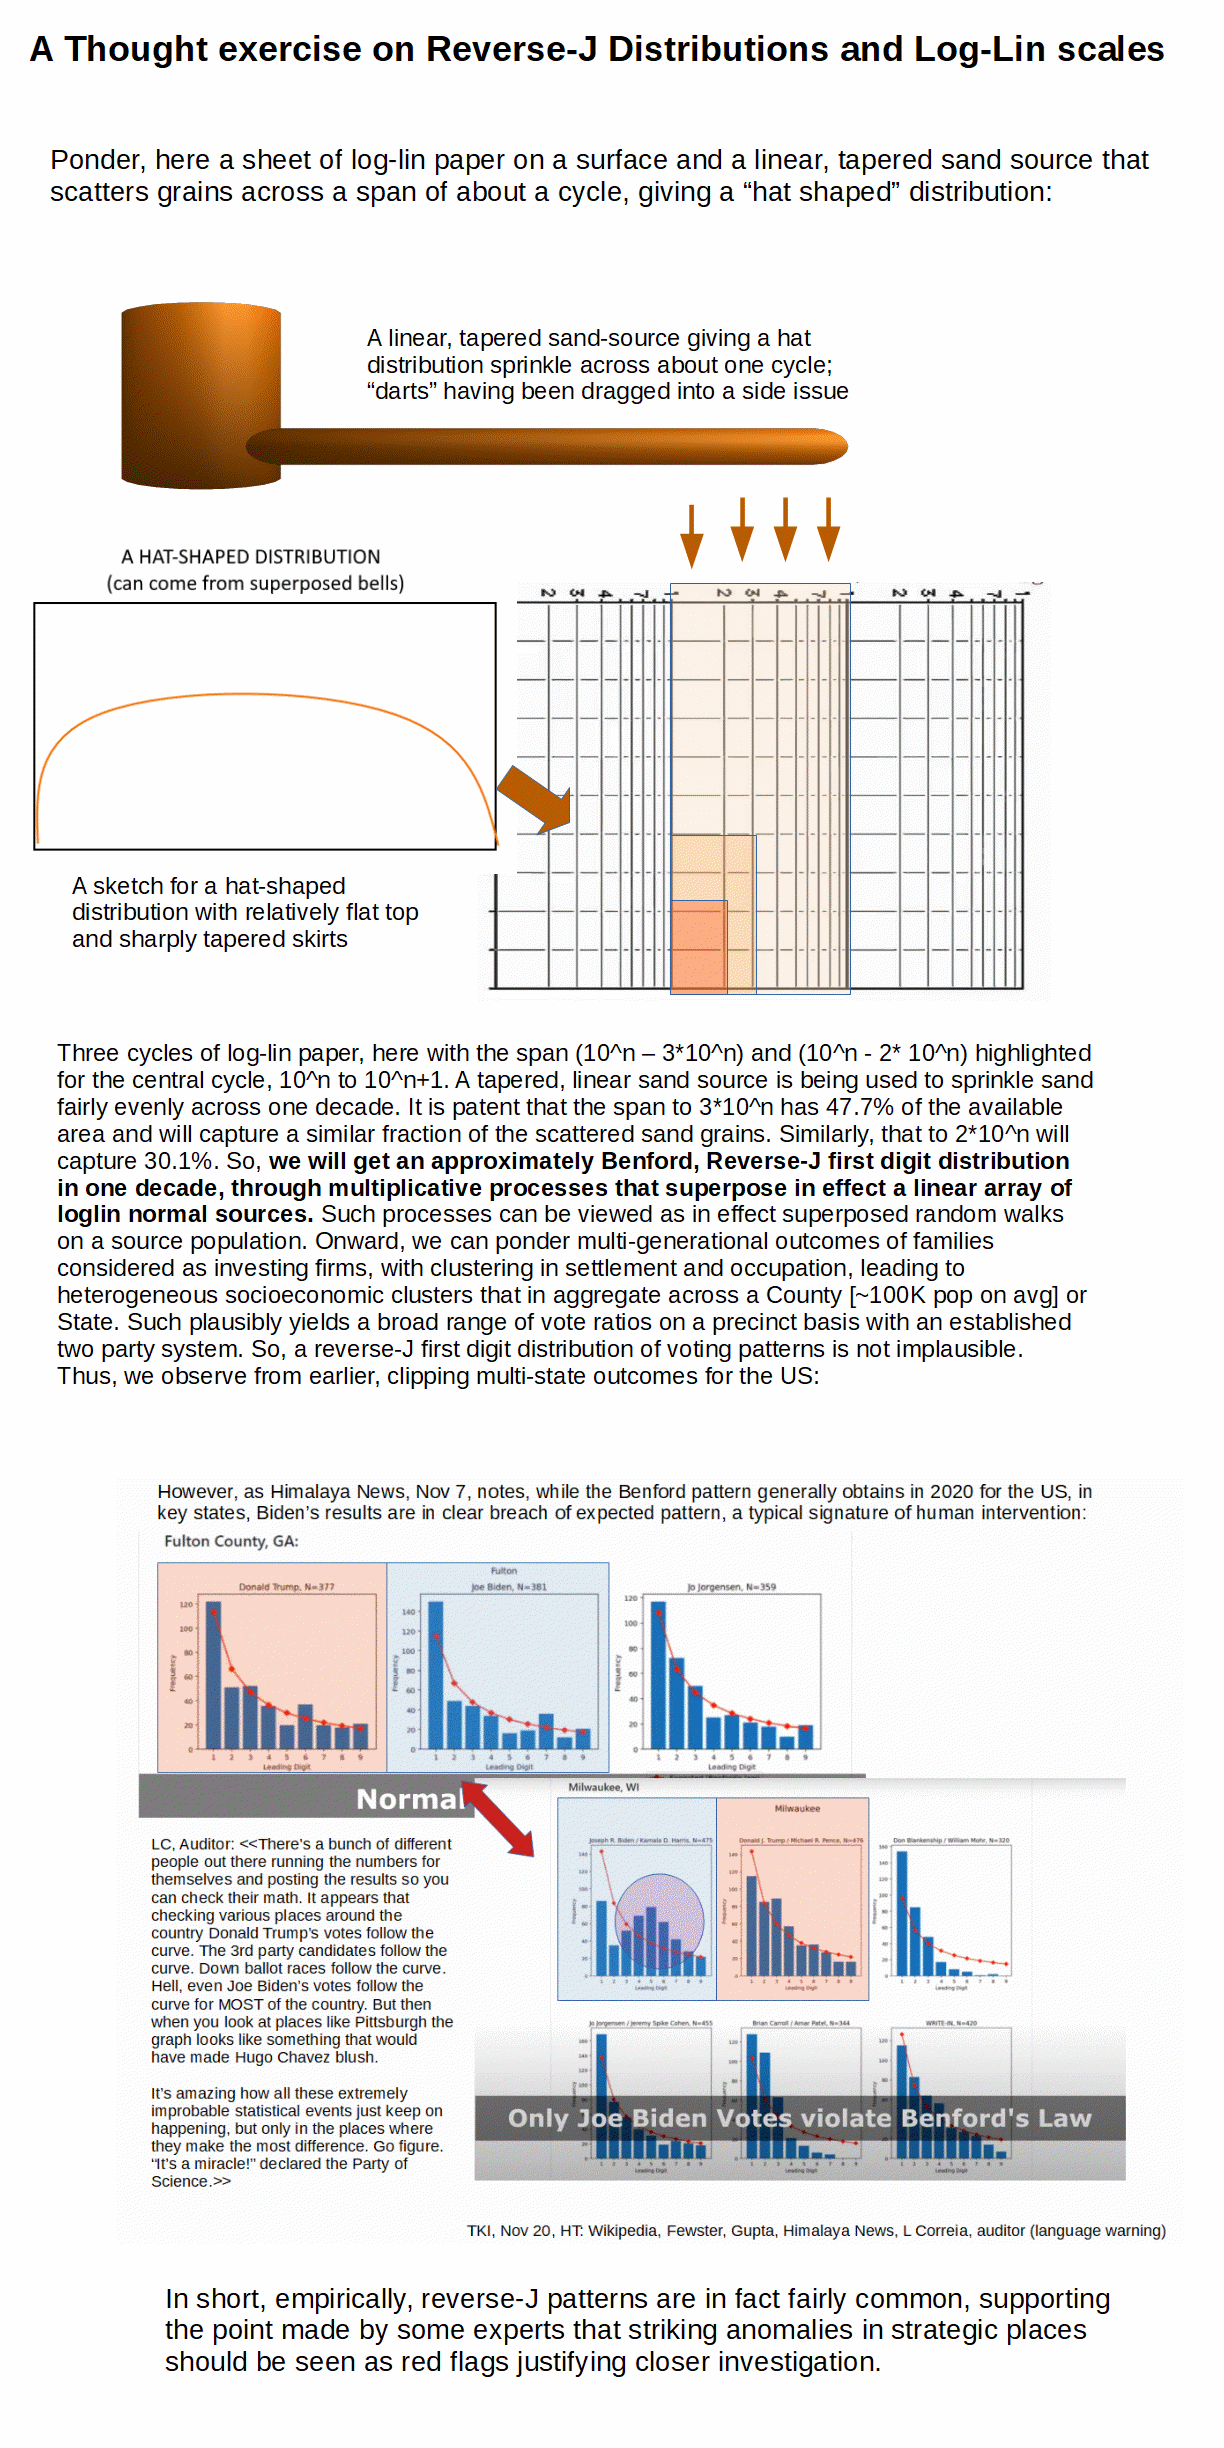
The Benford pattern is connected to log-normal distributions when numbers get spread across a big enough span of scale, typically by taking products of factors that are randomly spread.
The classic linear Gaussian normal distribution kicks in where small, additive random factors shift around a mean. Log-normal of course comes in as products become additions on logging. Likewise, there is an average product, with scatter on a log scale around that. Logs are truly powerful.
The Benford result apparently comes from that process, with the 30.1% ratio coming from log_10 2, the upper border for lead digit in a floating point/sci notation representation being 1. Log_10 3 is 0.477 to 3 dp, log_10 5 is 0.699 and log_10 9 is 0.954. This is why the taper. Now, if we tamper with a result from a lognormal generating process, typically we will add or subtract, or if we try to randomise we will try to go nearly flat random. It is hard to preserve a log-normal signature. Then, there is the second order trick, fluctuations are natural and too perfect a fit to a model is also suspect. Ask Mendel’s Gardner and Sir Cyril Burt’s ghost. The 2016 Russian election may be a case. It is hard to fake a good enough but not too good a fit, also.
Let’s illustrate:
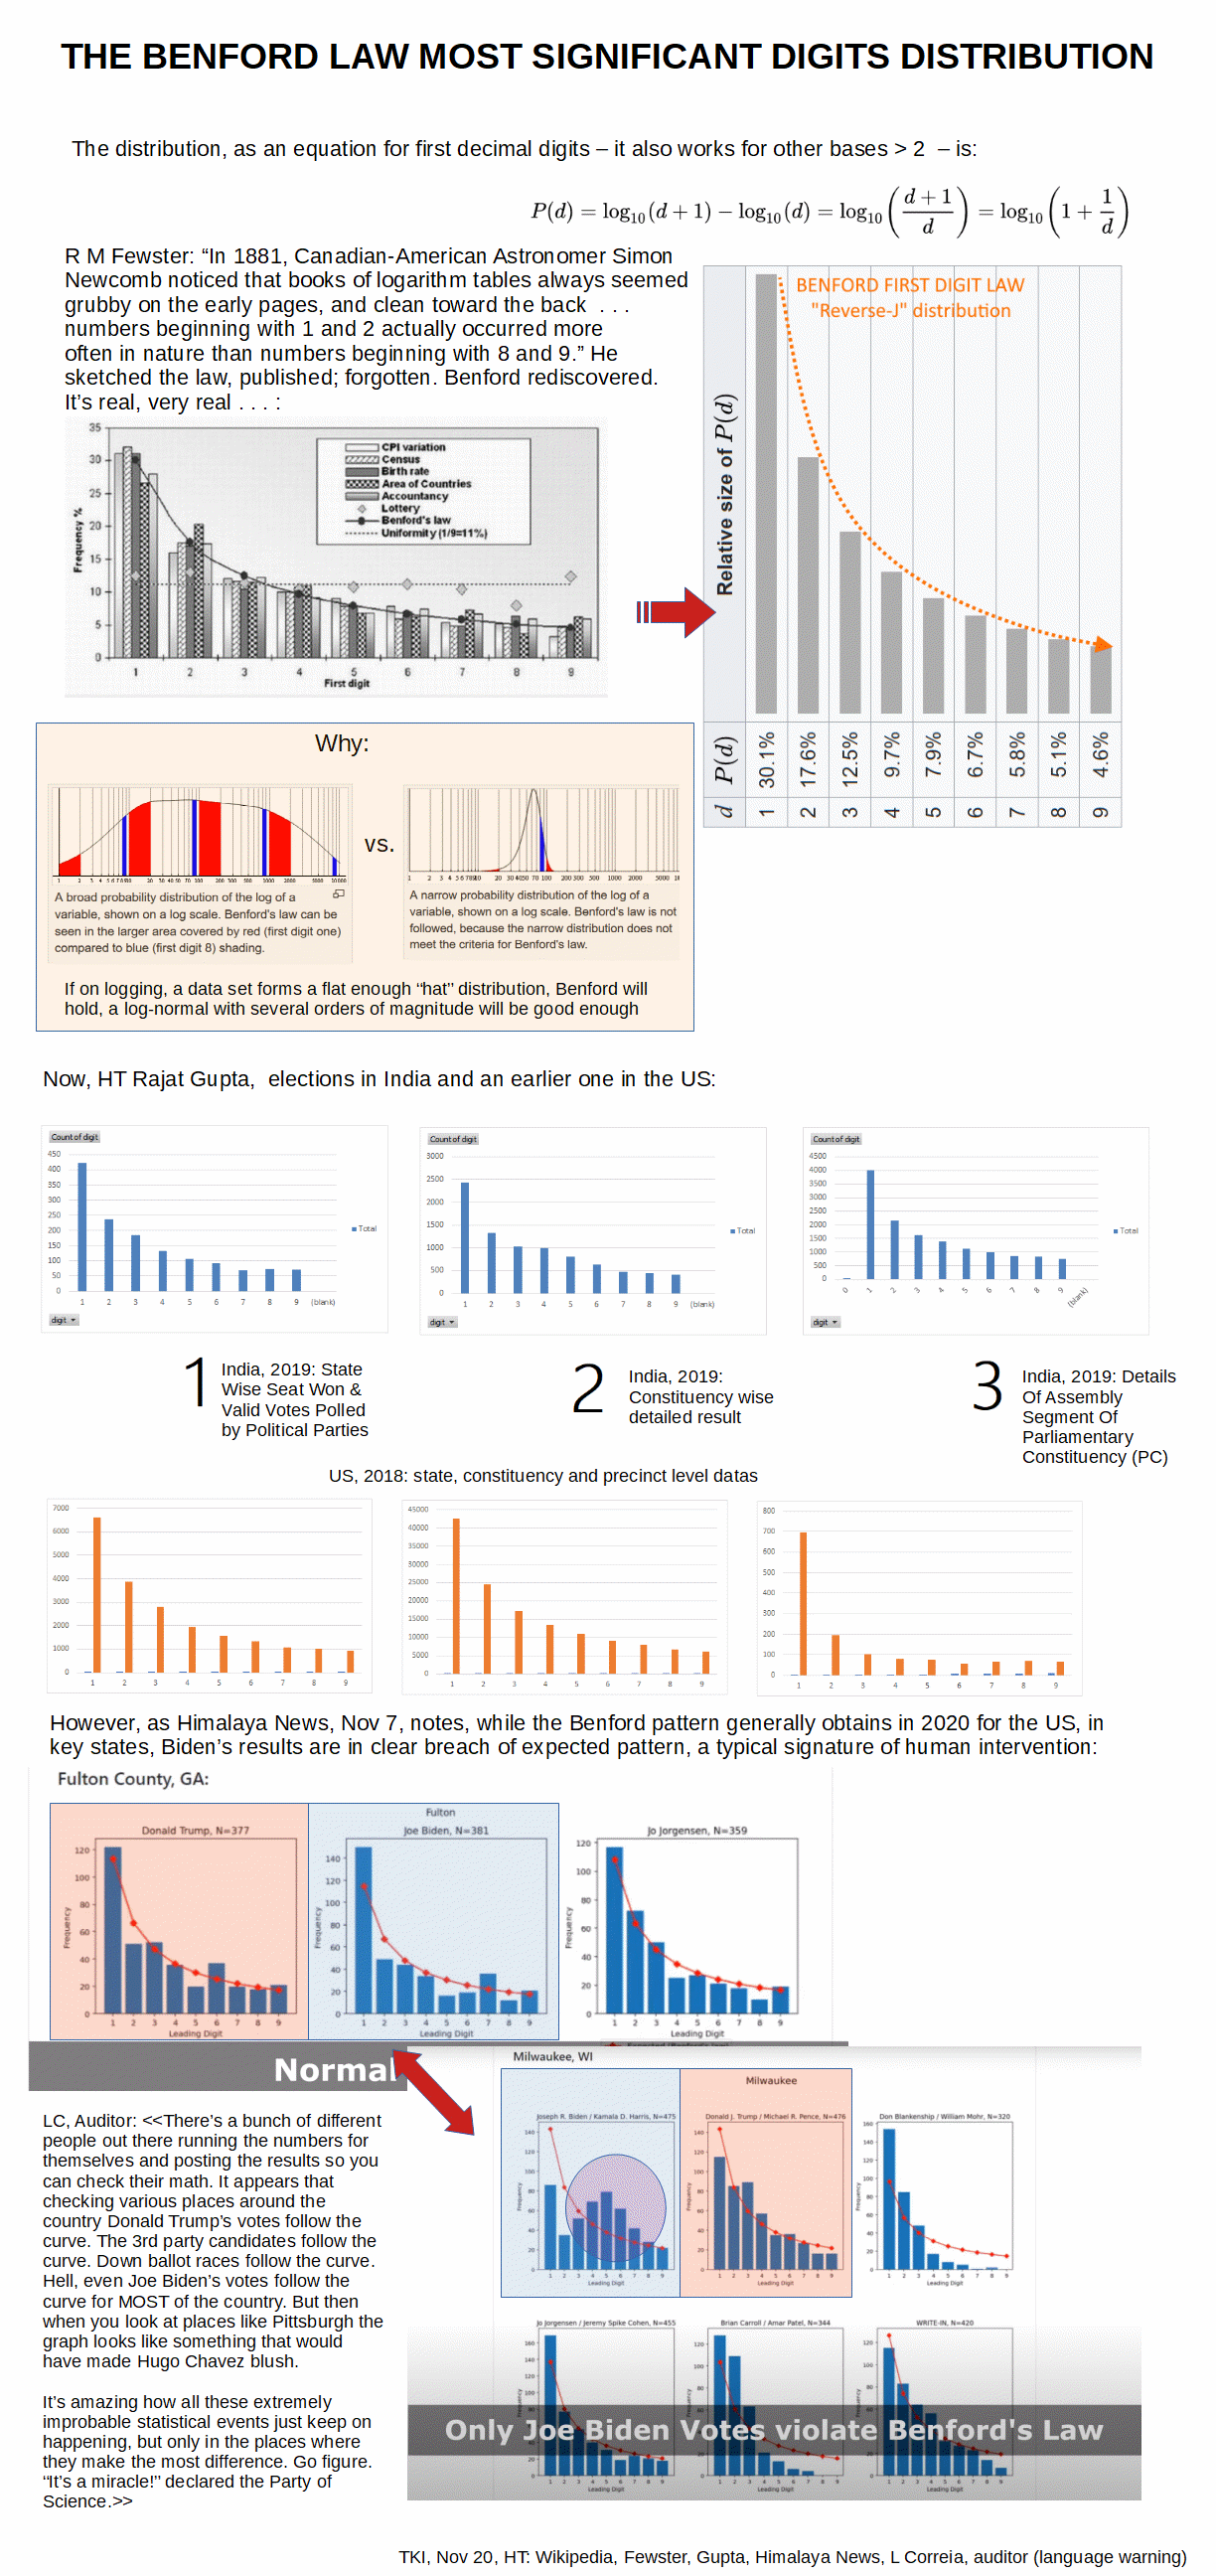
Such a signature is yet another strand in the rope of cumulative, mutually supportive evidence. It is highly plausible that something went very wrong with this election; which needs to be investigated. And with a suggested 500 affidavits in hand, such may well be going ahead.
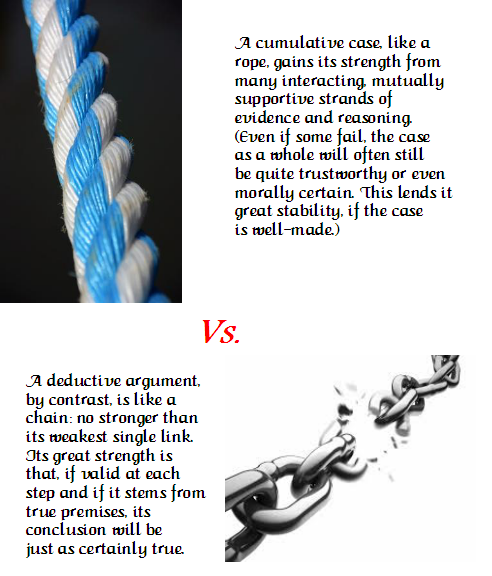
Speaking of which, on ropes and chains in argument:
U/D11: Mr Giuliani, for Mr Trump, speaks in a video, where he summarises the pattern of events spoken to in affidavits etc. Of direct interest to us at UD, from approx minute 19, he summarises the story and scale of a far-fluctuation vote cliff per affidavit he reports:
This video should be pondered i/l/o freshly added comments below, 780 and 781, also 770. I clip from 780, as this matter has been made into a target for dismissive comments, kindly read i/l/o U/D2 above:
Notice in particular, on at penalty of incarceration testimony regarding vote cliffs and steps, consistent with the scatter and linear plots above in OP:
Defendants instructed election workers to not verify signatures on absentee ballots, to backdate absentee ballots, and to process such ballots regardless of their validity. After election officials announced the last absentee ballots had been received, another batch of unsecured and unsealed ballots, without envelopes, arrived in trays at the TCF Center. There were tens of thousands of these absentee ballots, and apparently every ballot was counted and attributed only to Democratic candidates. Defendants instructed election workers to process ballots that appeared after the election deadline and to falsely report that those ballots had been received prior to November 3, 2020 deadline.
Note, again, how there were: “tens of thousands of these absentee ballots, and apparently every ballot was counted and attributed only to Democratic candidates.”
Vote cliff, this implies that there were 100% runs in the 100’s, 1,000’s or even 10,000’s classes. Such runs, if 100% are as calculated and shown in OP already. If the runs, esp at upper end were simply far fluctuation runs, they are just as tellingly unobservable on relevant time, space and event resources by natural chance variation.
Similarly in a video to be shortly added to OP [–> this appears just above], from 19 minutes or so on, there is a description of affidavit, where a bloc of some 100k ballots, with B-vote, president only markings was received by back door approx 4:30 am, and rapidly counted in with hindrance of control checks. These were apparently perceived as all B-votes, duly adjusted by caution to virtually all . . . i.e. far fluctuation . . . B votes. This again fits in with descriptions of GA on 90k+ utterly B-dominant, president only votes, with less than 1k T-votes of the same character; and with the Briggs analysis of 10k+ class blocs of votes in PA that are utterly overwhelmingly B-votes, as is illustrated in the OP.
In short, the far fluctuation vote cliff of 100% and near 100% runs is credibly so on convergent evidence across states and across a continental span.
The attempted skeptical dismissals above fail. Except, insofar as they help us see that we are looking at urban based machine politics with ability to do such.
It is time to face the realities of a seriously flawed election process and in particular strong indicators of willful, election manipulating misconduct that in key cases raises questions of mens rea.
U/D12: The MI voting pattern analysis of Dr Shiva and colleagues. Video:
Scatter-plots are our friends, and so here are some screen captures that help us see a disturbing, red flag pattern:
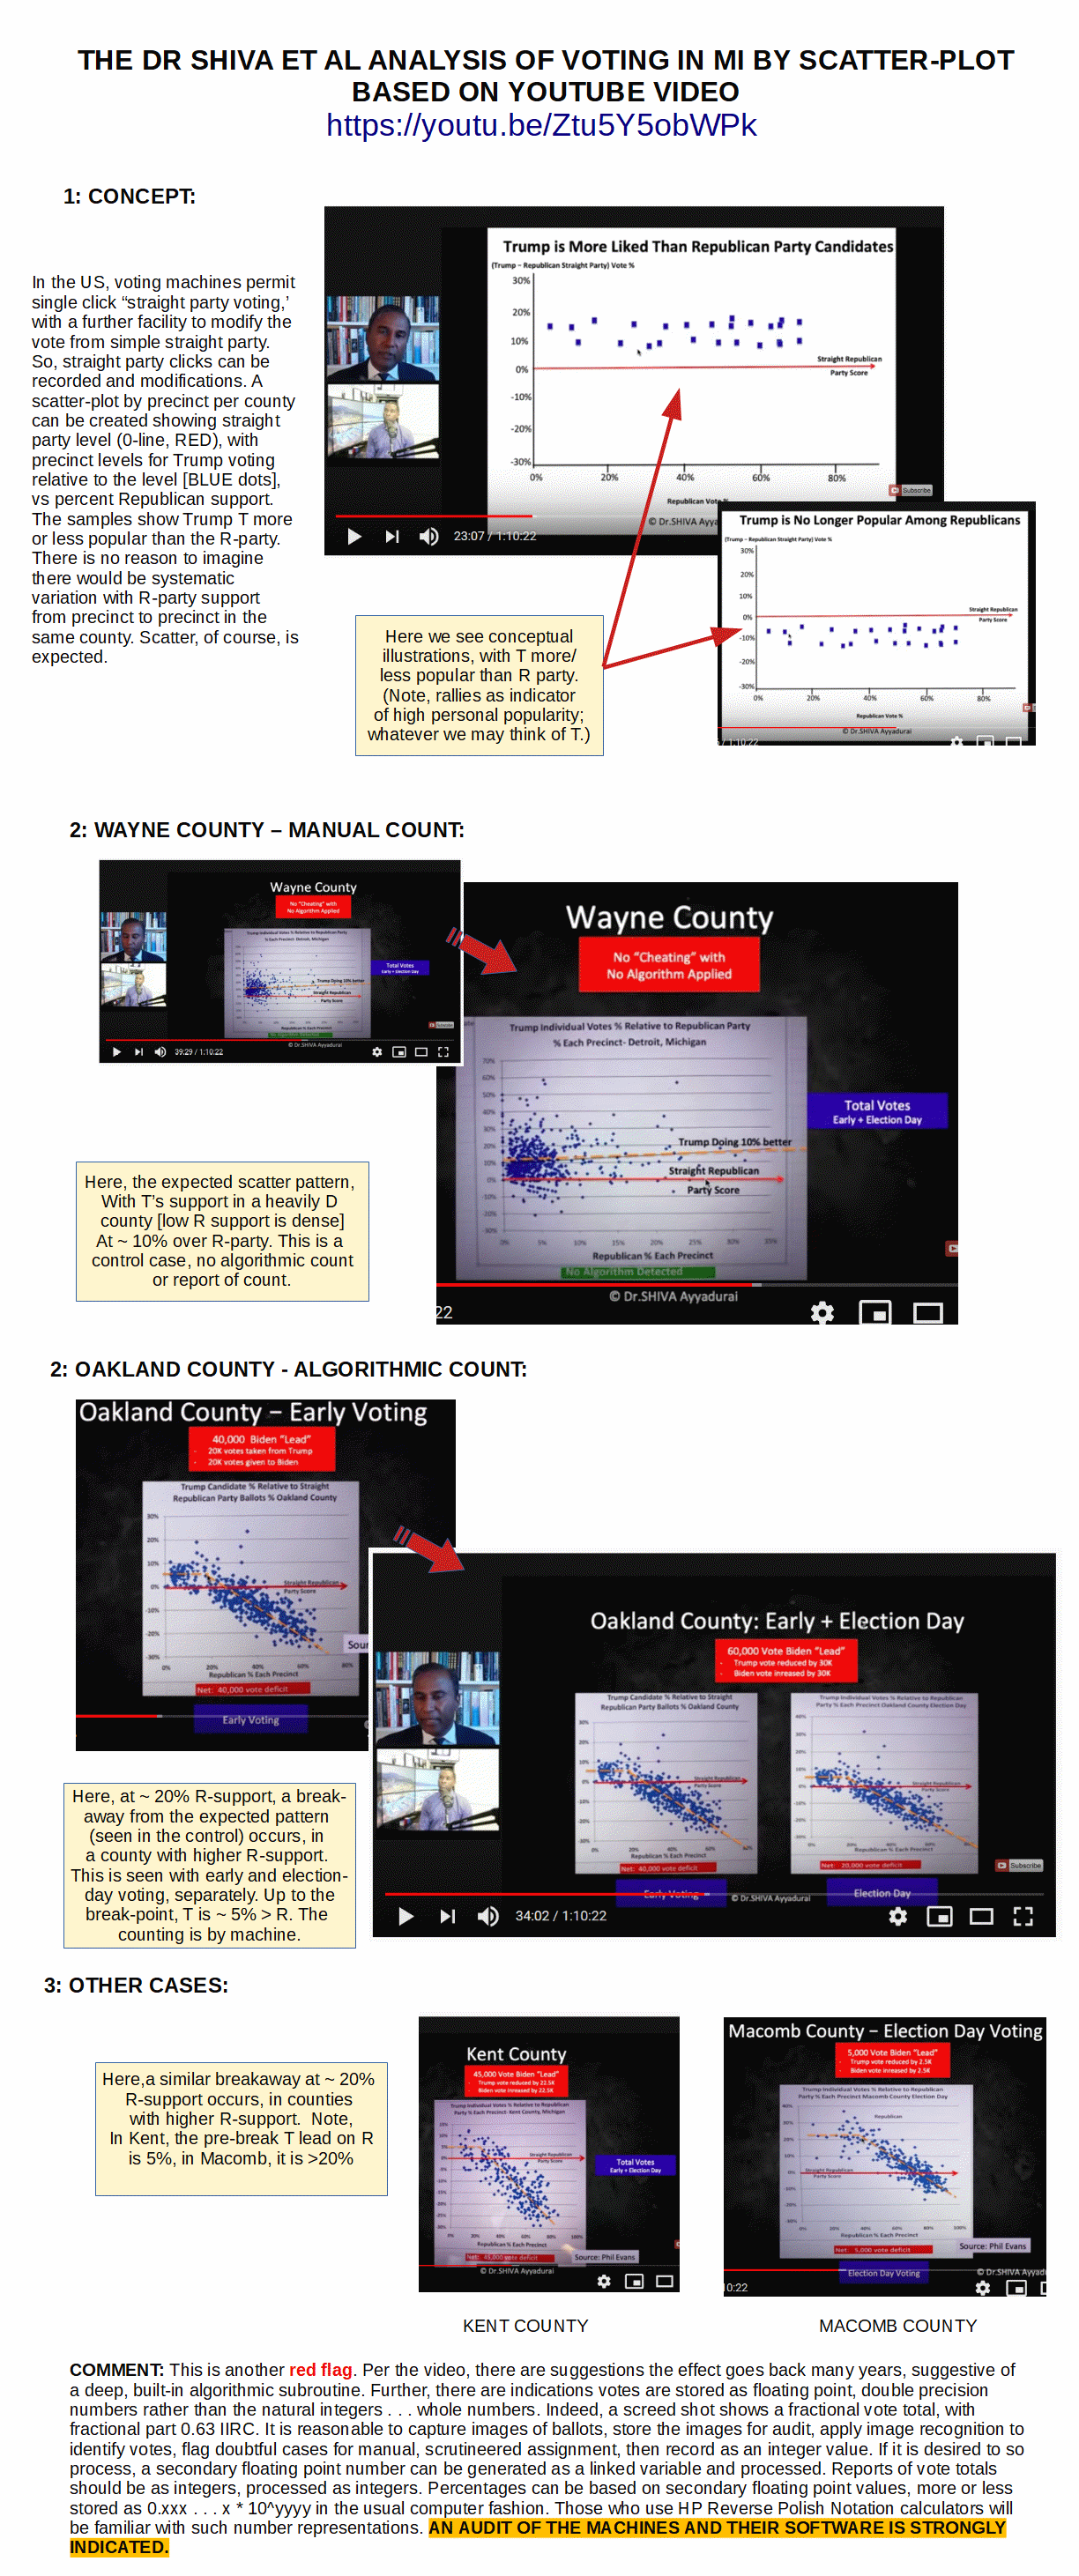
It is time for a very serious reappraisal of the integrity of the US electoral system. Given the conceptual expectation and confirmation from a hand-counted county, there is reason to expect the conceptual pattern. That the pattern is in fact followed for low- levels- of- support precincts then switches to a down-sloping ramp at ~ 20% is not reasonable, on its face. Especially, when we see a clear further pattern that — unsurprisingly — Mr Trump is more popular than his adopted party, in turn varying from county to county. Perhaps, somehow there is an innocent explanation; that needs to be produced and empirically verified.
U/D13: Complacency about elections is not just an American phenomenon. UK Independent, 2011:
‘Shocking complacency’ from a group safeguarding elections
Wednesday 16 February 2011 01:00 |
Today’s report from the Electoral Commission is a bizarre exercise in asking Britain’s voters to keep calm and carry on. Its view is that voting fraud is not widespread because almost no one has been prosecuted for it and that even if fraud did occur, it did not have any effect on the outcome of an election. For an organisation that is supposed to safeguard the integrity of our voting system, such complacency is shocking.
Unfortunately, ballot fraud is very easy to do in Britain. But proving it is much harder. Just because police rarely prosecute someone does not mean there are no grounds for an investigation. When I was attacked last year while investigating alleged corruption in East London, I received numerous calls from constituents on all sides of the political divide thanking the newspaper for looking into an issue they felt had been long ignored. Last year’s general election was observed by election monitors from Commonwealth nations like Sierra Leone, Bangladesh and Ghana and even they were shocked by how “corruptible and open to fraud” the British voting system is.
Let us ponder further, from Votescam, 1992:
The computers that spoke in November 1988 held in their inner workings small boxes that contained secret codes that only the sellers of the computers could read. The programs, or “source codes,” were regarded as “trade secrets,” The sellers of the vote-counting software zealously guarded their programs from the public, from election officials, from everyone—on the dubious grounds that competitors could steal their ideas if the source codes were open to inspection.
You may ask: What “ideas” does it require to count something as simple as ballots?
Can the “ideas” be much more complex than, let’s say, a supermarket computerized cash register or an automatic bank teller machine?
The computer voting machines do not have to do anything complicated at all; they simply must be able to register votes for the correct candidate or party or proposal, tabulate them, count them up, and deliver arithmetically correct additions. People with no formal training, even children, used to do it all the time.
So why can’t the public know what those secret source codes instruct the computers to do? It only makes common sense that every gear, every mechanism, every nook and cranny of every part of the voting process ought to be in the sunlight, wide open to public view.
How else can the public be reasonably assured that they are participating in an unrigged election where their vote actually means something?
Yet one of the most mysterious, low-profile, covert, shadowy, questionable mechanisms of American democracy is the American vote count . . .
Begin to see the depth and spread of the problem?
(And, take time to read Votescam, here, concern has been on record for nearly 30 years regarding corruptibility of computerised voting schemes. While of course there are many confident manner dismissals, the rash of concerns highlighted above should give pause. Sadly, predictably, for many mere words and statistical patterns will not be enough. That is in key part why we are in for a wild ride over the next fourteen or so months as strategic decision sets in for the ongoing 4G civil war in the shadows.)
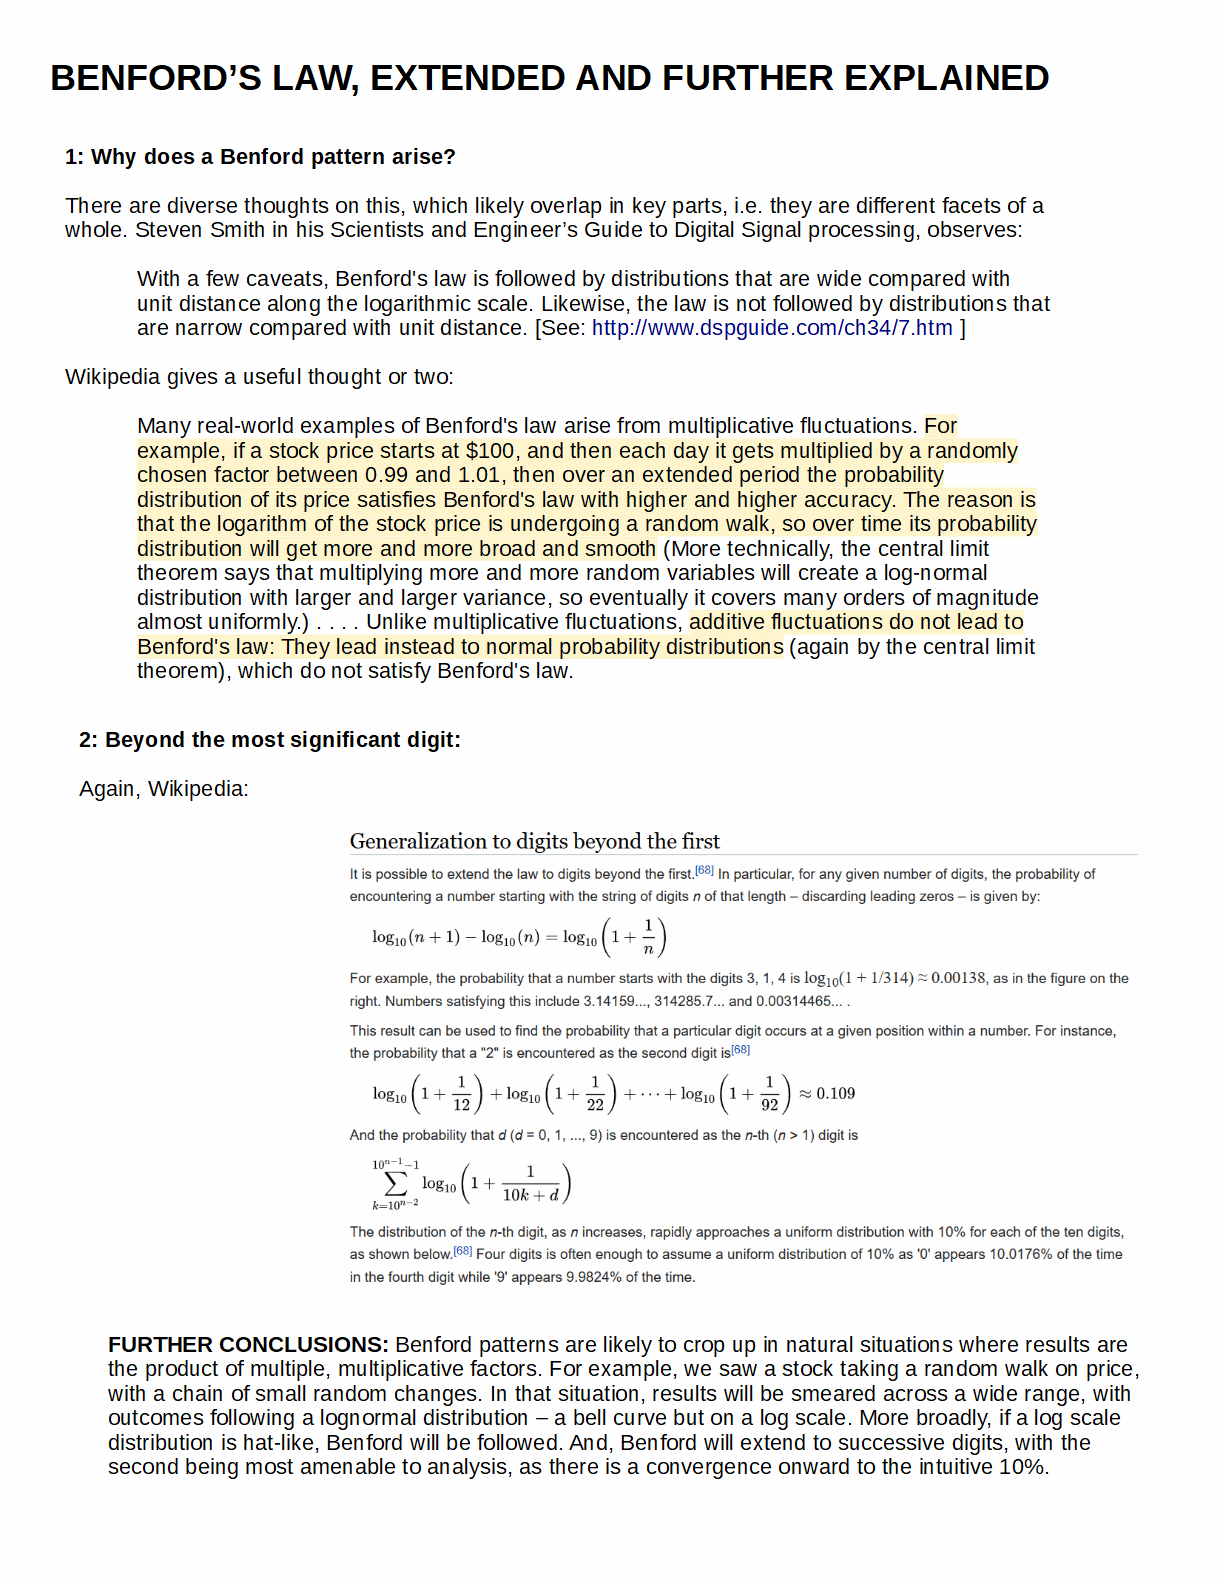
U/D14: I wish to make further notes on the Benford pattern, as I think it an important bit of Math/statistical general background relevant to a sound understanding of reality. The use of this in detecting fraud (as a red flag) is important, but the underlying dynamics of how sets of numbers arise and how they reflect their roots is also important. First, a video tutorial:
Now, let’s ponder the two digits case (with help of Wikipedia):
From the video, we may clip a tabulation of expected onward digits, noting that 0 now becomes a possible digit:
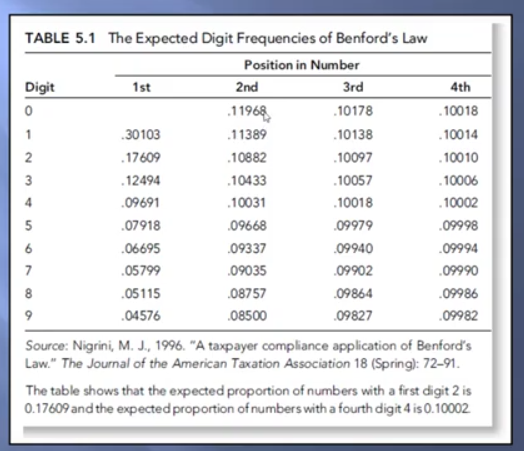
Convergence on 0.10 is obvious but with big enough sets of numbers at least the second and perhaps the third digits can be tested. This way, we could create a cumulative case. It would be interesting to see a first-second digit analysis of the precinct level outcomes, especially treating the second as reflecting a conditional probability on the first. That might be a fascinating audit-related exercise.
We can take it as granted that depending on circumstances this will show up. In that context, the concern raised by our auditor (cf. 636 below) is valid:
You’ve probably also seen a lot of mention of Benford’s Law over the last few days. Posts talking about it have been getting vanished off of Facebook (that I can confirm firsthand). https://theothermccain.com/2020/11/09/articles-mentioning-benfords-law-are-reportedly-banned-on-facebook/
Basically, when numbers are aggregated normally, they follow a distribution curve. When numbers are fabricated, they don’t. When human beings create what they think of as “random” numbers, they’re not. This is an auditing tool for things like looking for fabricated invoices. It also applies to elections. A normal election follows the expected curve. If you look at a 3rd world dictatorship’s election numbers, it looks like a spike or a saw.
There’s a bunch of different people out there running the numbers for themselves and posting the results so you can check their math. It appears that checking various places around the country Donald Trump’s votes follow the curve. The 3rd party candidates follow the curve. Down ballot races follow the curve. Hell, even Joe Biden’s votes follow the curve for MOST of the country. But then when you look at places like Pittsburgh the graph looks like something that would have made Hugo Chavez blush.
It’s amazing how all these extremely improbable statistical events just keep on happening, but only in the places where they make the most difference. Go figure. “It’s a miracle!” declared the Party of Science.
We can actually see that from U/D10 above.
Obviously, not a proof but a point for concern among a rash of others. This broad issue is not going away.
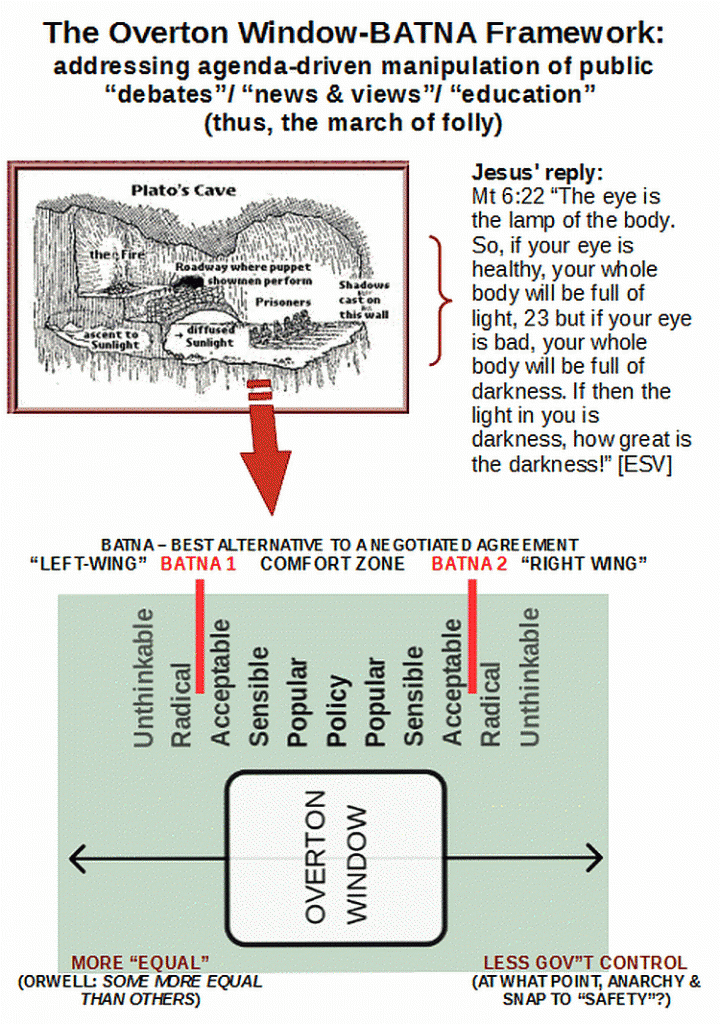
U/D15: Below, at 1019, I provided a discussion on random walks that shows why Benford type distributions of political views and voting patterns are fairly likely in sufficiently heterogeneous, distributed populations. One of the issues that emerged as relevant is the Overton Window, so, here is a perspective on it:
U/D16: More on Scatter-plots in MI, with the fresh analysis in 1019 in the background on why we expect heterogenous, reverse-J voting patterns on a state-wide scale:
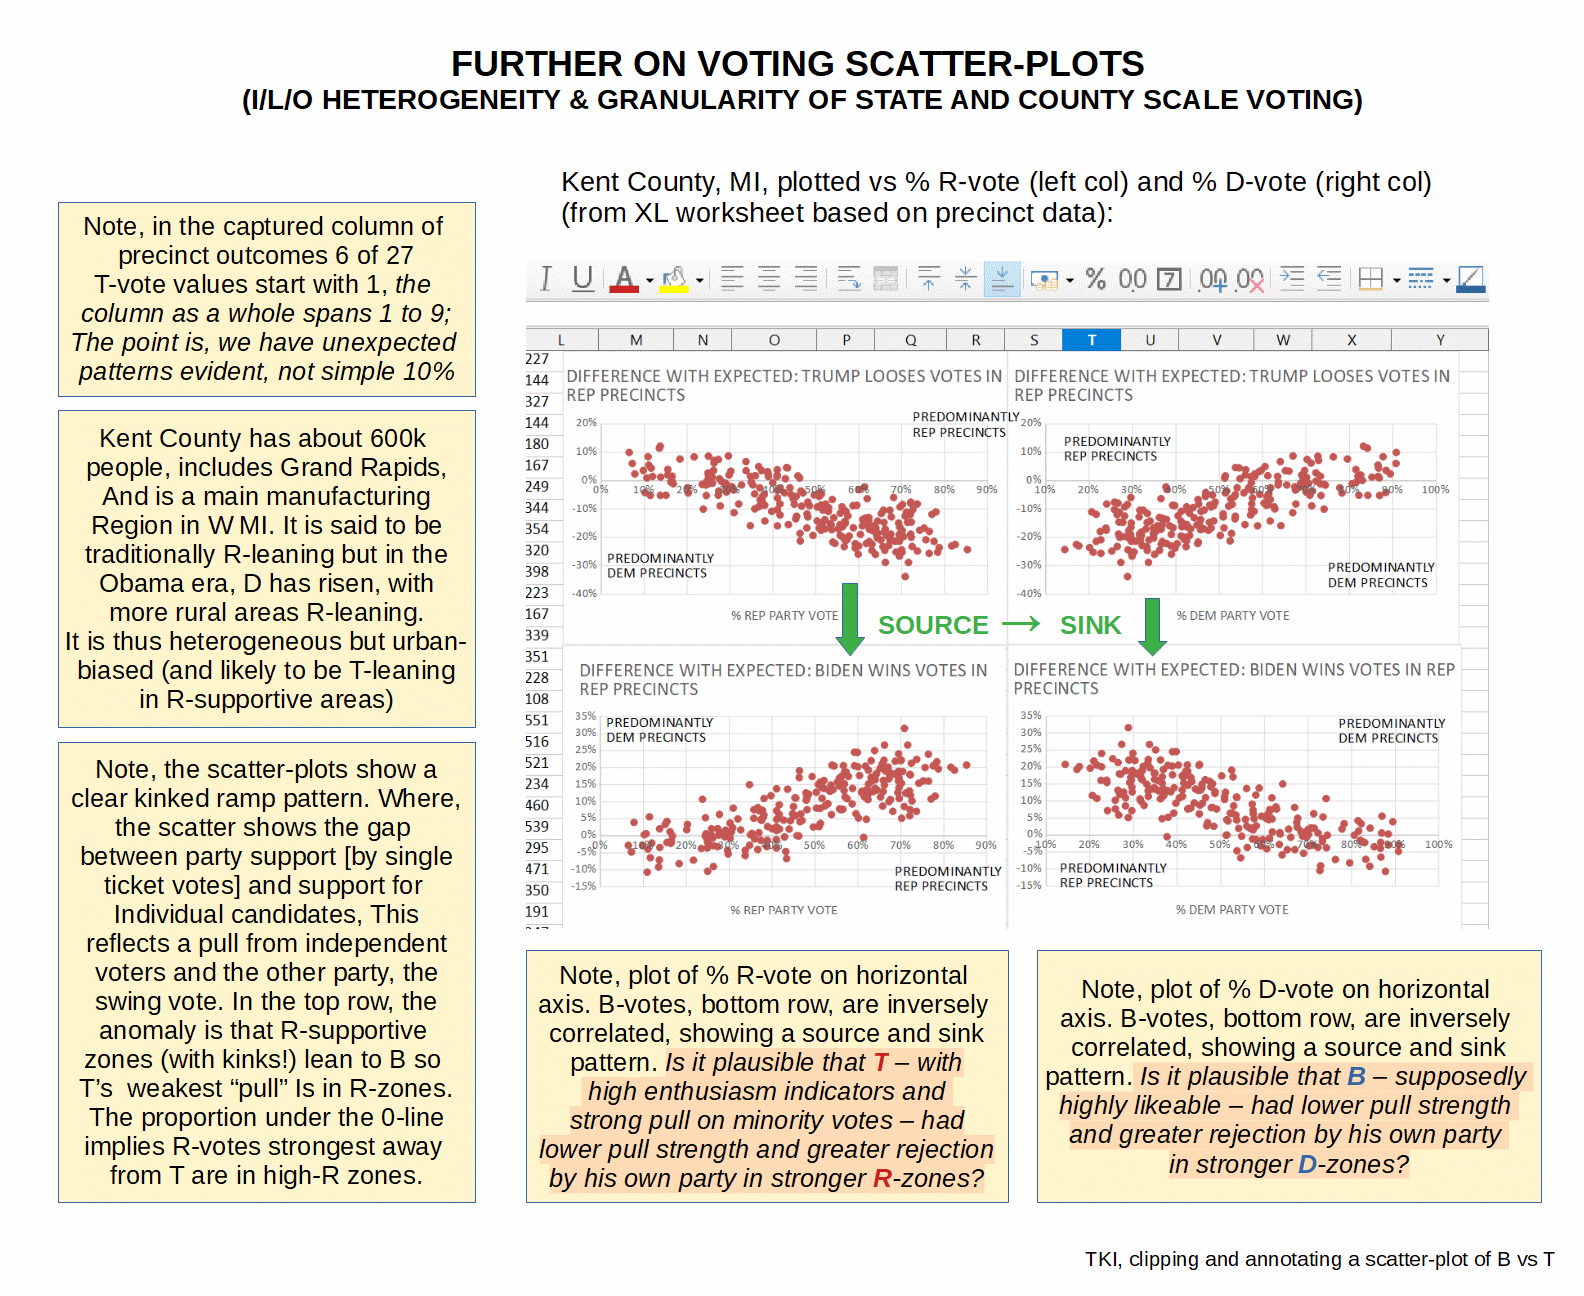
In discussion of the Dr Shiva scatter-plots, a YT commenter linked his own correlated B- vs T- plots, clipped above. There is a clear source-sink correlation in deviations from the straight-ticket vote baseline [a proxy for strong party support]. We also notice kinked ramps, with the knee at about 20%. The plausibility questions highlighted in orange, frame the issue of how such a pattern is to be best explained.
(Also, the extreme L captures a slice of precinct outcomes, giving at least a hint that we are not seeing the naive flat response. BTW, the 9-lead cases come at the low end. Scanning by eye, T-votes in precincts run from 8 to 555 in 251 cases, total 59,095, average 236, pretty nearly mid point. This is nearly two orders of magnitude, so it seems the spread out heterogeneity criterion is met at precinct level aggregated to even county level. Mind you, 600k people as smallest unit of aggregation, county, is well over the median for small countries in the Caribbean. I do recall learning that in China, counties routinely have 2 – 3 millions. I see there are 3,141 “counties” in the US, implying average pop. over 100k.)
U/D16: A Lou Dobbs discussion with Ms Sidney Powell during which she reads from an affidavit on origin of the Dominion systems software and what it can do:
Food for thought, and recall, an affidavit is evidence notarised under penalty of incarceration. It is evidence. DV, later, on background regarding relevant McFaul colour revolution election manipulation patterns.
U/D17: Extending the McFaul Colour Revolution Programme and SOCOM Insurgency Escalator, through the Tefft election fraud/manipulation techniques:
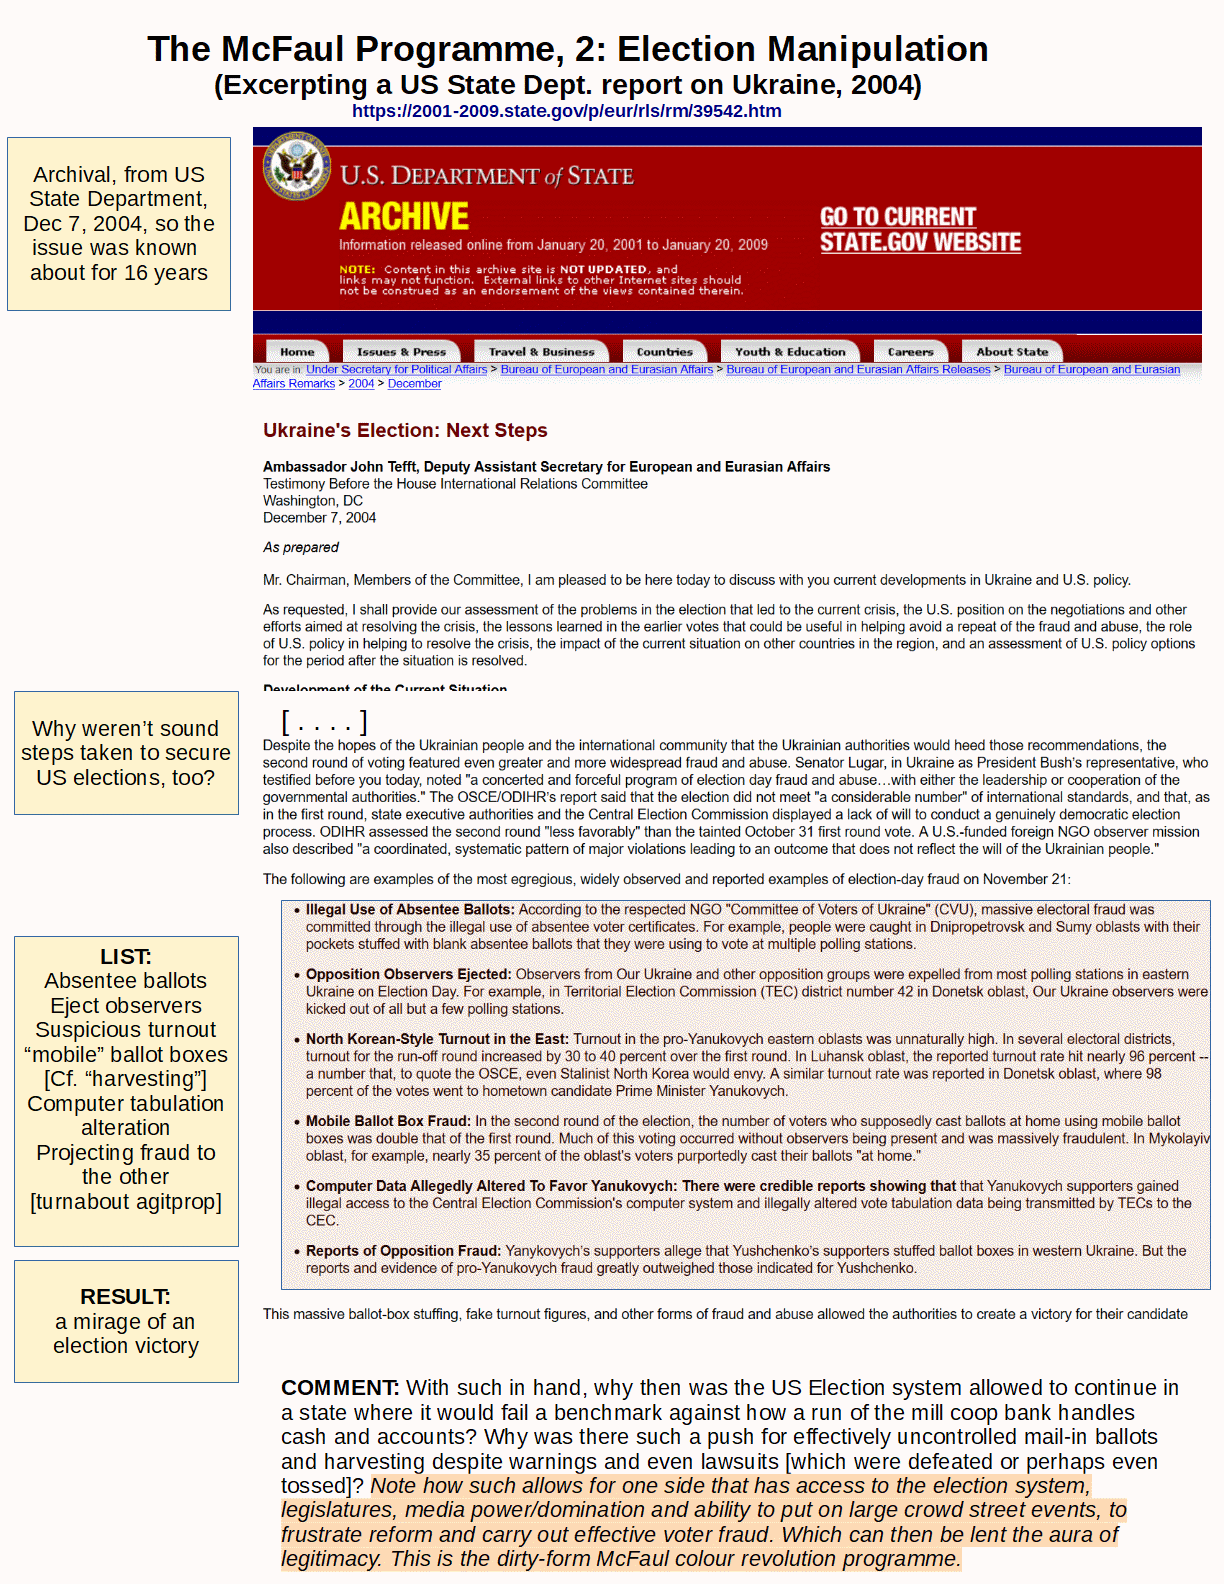
Let us compare, again, the McFaul-SOCOM framework:

To focus attention, let us clip the list of election fraud techniques, c. 2004:
- Illegal Use of Absentee Ballots: According to the respected NGO “Committee of Voters of Ukraine” (CVU), massive electoral fraud was committed through the illegal use of absentee voter certificates. For example, people were caught in Dnipropetrovsk and Sumy oblasts with their pockets stuffed with blank absentee ballots that they were using to vote at multiple polling stations.
- Opposition Observers Ejected: Observers from Our Ukraine and other opposition groups were expelled from most polling stations in eastern Ukraine on Election Day. For example, in Territorial Election Commission (TEC) district number 42 in Donetsk oblast, Our Ukraine observers were kicked out of all but a few polling stations.
- North Korean-Style Turnout in the East: Turnout in the pro-Yanukovych eastern oblasts was unnaturally high. In several electoral districts, turnout for the run-off round increased by 30 to 40 percent over the first round. In Luhansk oblast, the reported turnout rate hit nearly 96 percent — a number that, to quote the OSCE, even Stalinist North Korea would envy. A similar turnout rate was reported in Donetsk oblast, where 98 percent of the votes went to hometown candidate Prime Minister Yanukovych.
- Mobile Ballot Box Fraud: In the second round of the election, the number of voters who supposedly cast ballots at home using mobile ballot boxes was double that of the first round. Much of this voting occurred without observers being present and was massively fraudulent. In Mykolayiv oblast, for example, nearly 35 percent of the oblast’s voters purportedly cast their ballots “at home.”
- Computer Data Allegedly Altered To Favor Yanukovych: There were credible reports showing that that Yanukovych supporters gained illegal access to the Central Election Commission’s computer system and illegally altered vote tabulation data being transmitted by TECs to the CEC.
- Reports of Opposition Fraud: Yanykovych’s supporters allege that Yushchenko’s supporters stuffed ballot boxes in western Ukraine. But the reports and evidence of pro-Yanukovych fraud greatly outweighed those indicated for Yushchenko.
Of course, exit polling etc were used as a reference:
This massive ballot-box stuffing, fake turnout figures, and other forms of fraud and abuse allowed the authorities to create a victory for their candidate that almost certainly would not have been possible in a free and fair election. The final figures announced by the Central Election Commission (CEC) gave Prime Minister Yanukovych with 49.46 percent of the vote over opposition candidate Yushchenko with 46.61 percent. It is impossible to know what the real numbers were, but a large-scale (20,000 respondents), nation-wide anonymous exit poll conducted by a consortium of three highly respected research organizations (partially funded by the United States Government) projected Yushchenko the winner with 53 percent versus 44 percent for Yanukovych. Other exit polls and parallel vote counts indicated a Yushchenko victory, although by lesser amounts.
Such polling now stands discredited through repeated inaccuracies, sometimes gross.
Further to this, we must face the pattern of street tactics, sing off the same hymn sheet media, rash of red flags and more. Of particular significance we can find striking parallels to the course of events in Egypt during that phase of the Arab Spring (which also raises the issue of external interference and linked issues over social media networks, manipulation and censorship), raising the question of the feasibility of coup by street level action joined to election manipulation once there is an atmosphere of crisis that leads to a tendency to surrender normal safeguards.
U/D18, Nov 18, to illustrate why it is not unreasonable that a Benford pattern-like reverse-J distribution can emerge from a random walk driven process across a single cycle of magnitude:
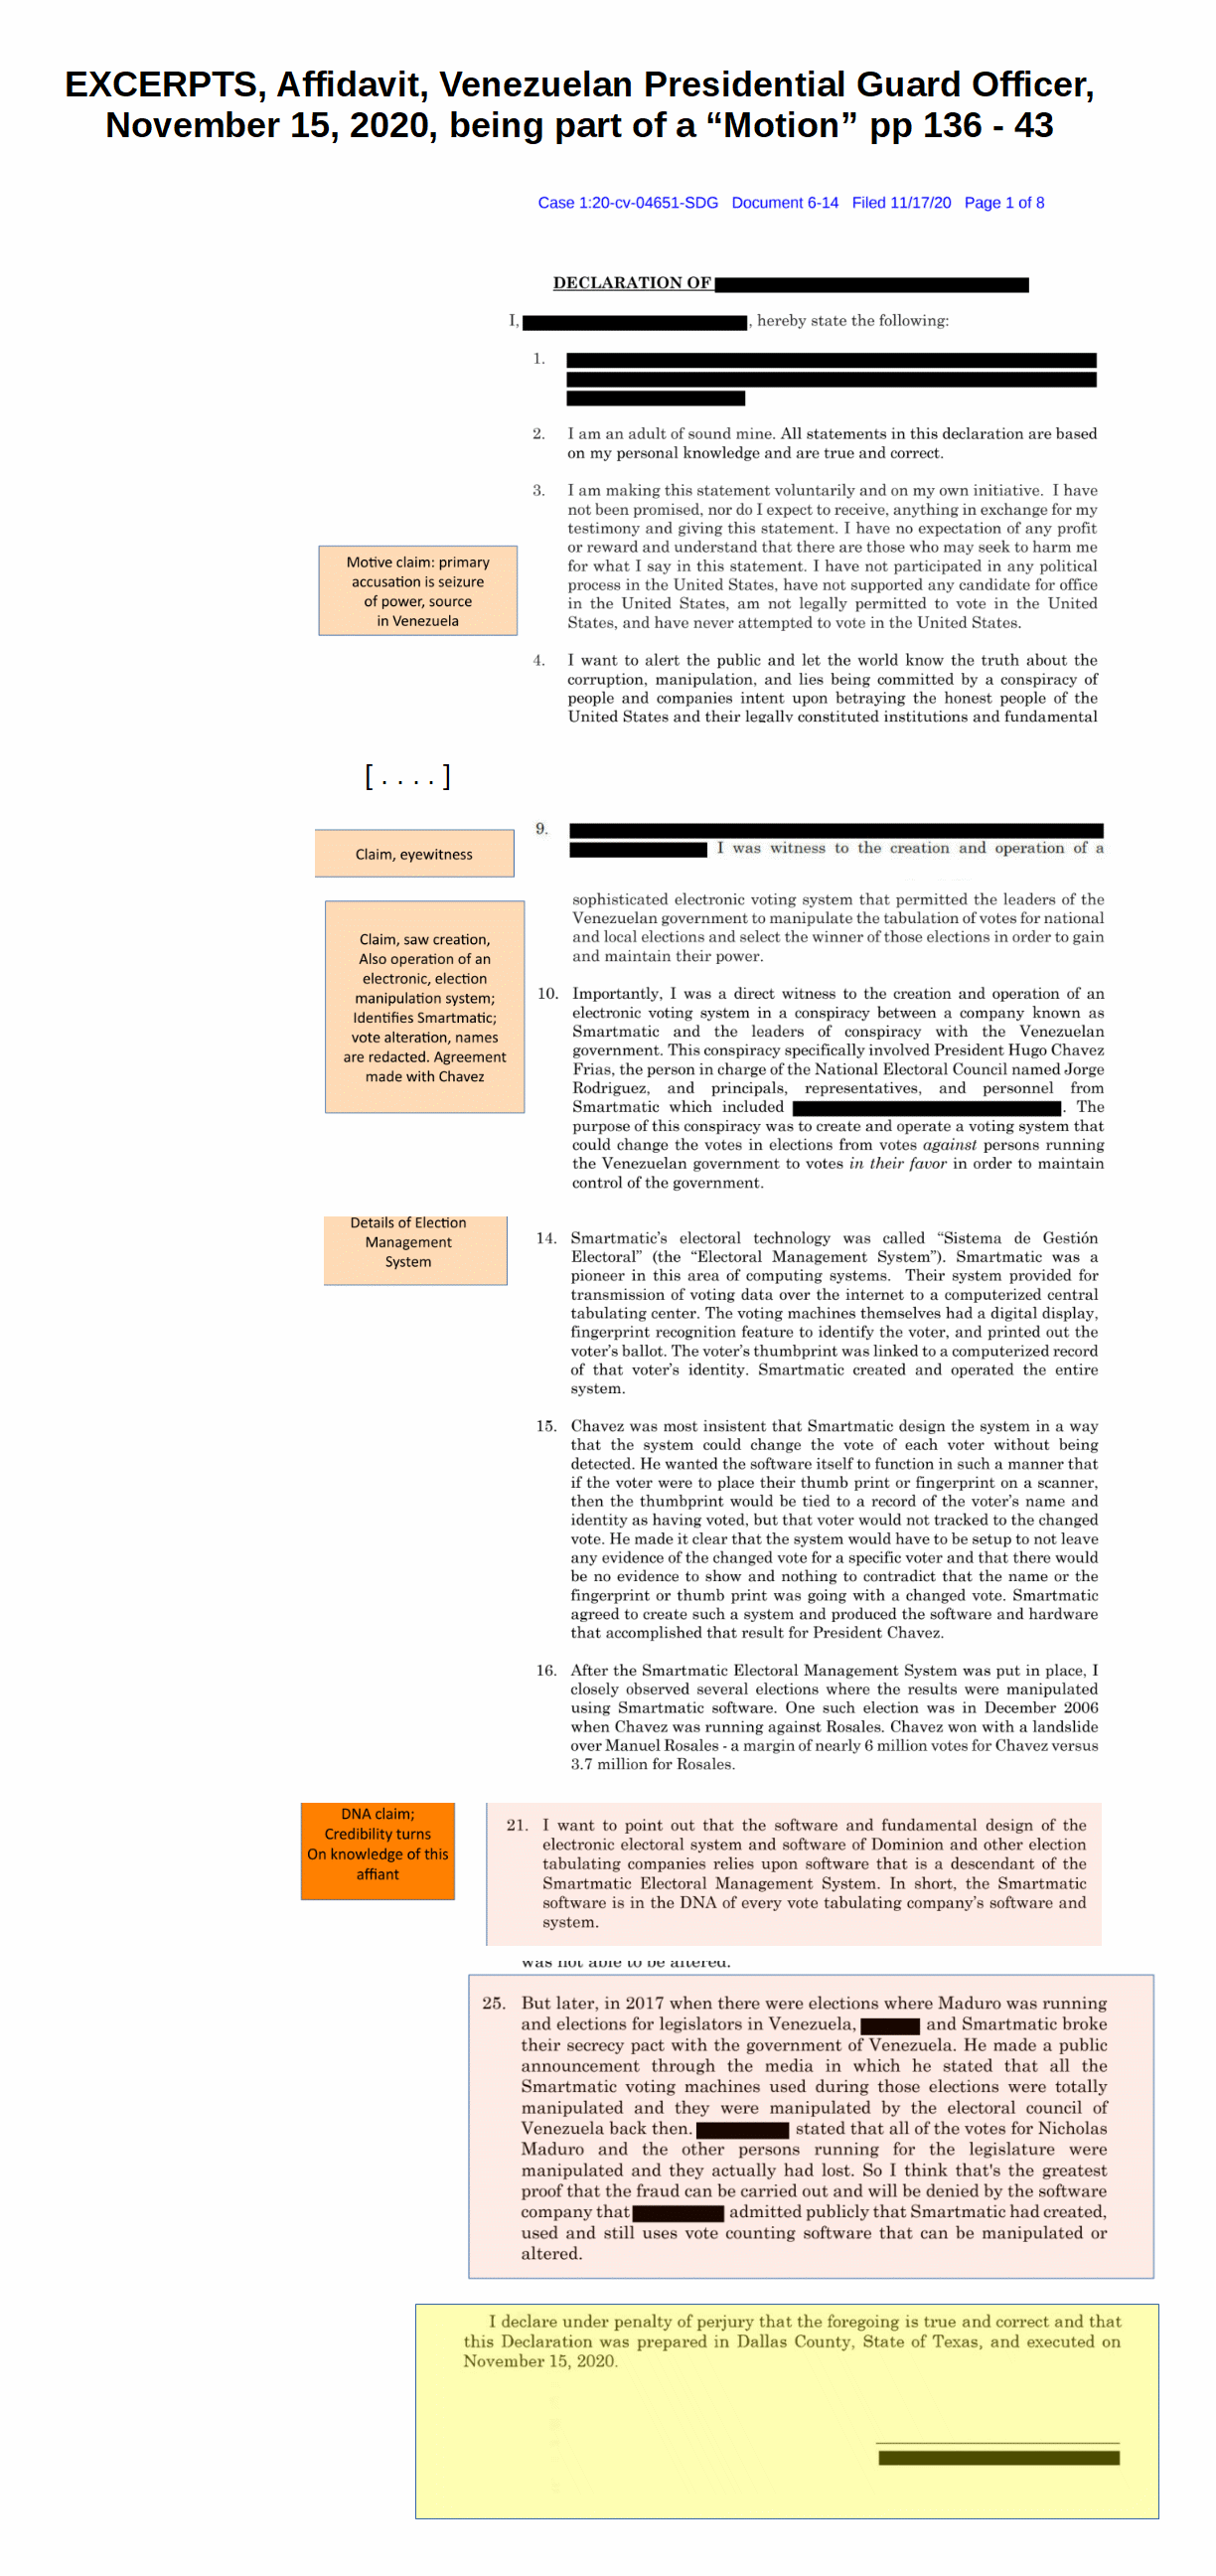
U/D19, Nov 18, excerpts from Affidavit announced by Ms Powell, as a basis for discussion (there is no implication of across the board endorsement, but the penalty acknowledgement should be noted):
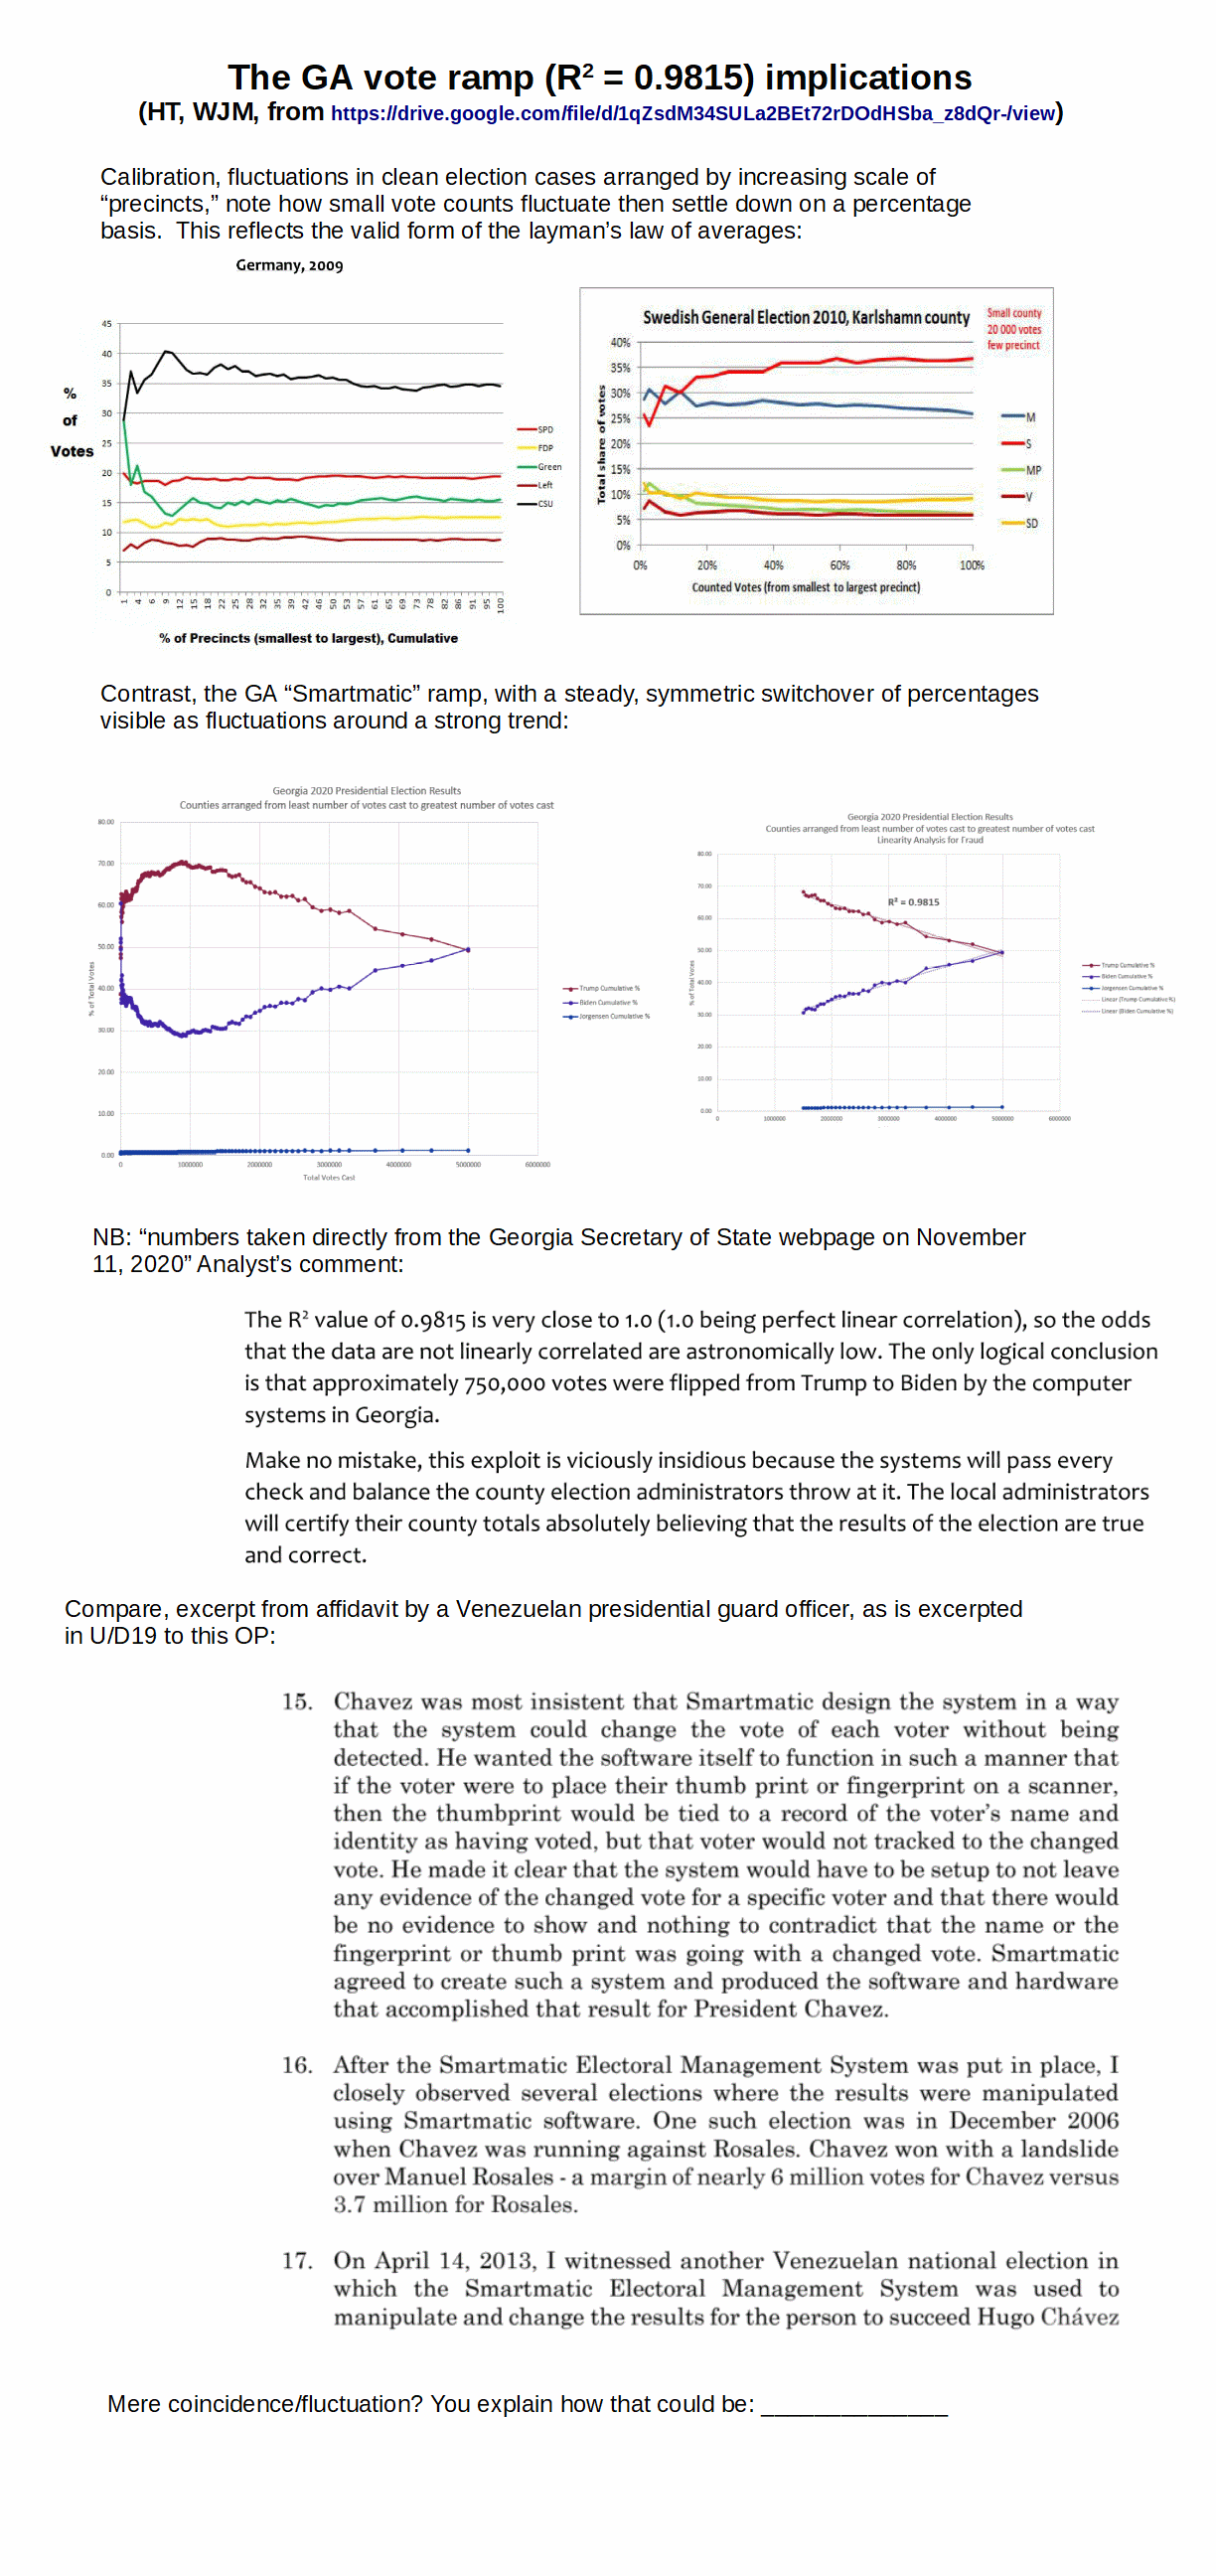
U/D20, Nov 19: The Georgia Election Ramp:
U/D21, for reference, Guiliani-Powell press conference: . . . further update, a 1 h 40 min version:
U/D22, Nov 21: More on fluctuations, vote cliffs and staircase trends (with PS f-curve added):
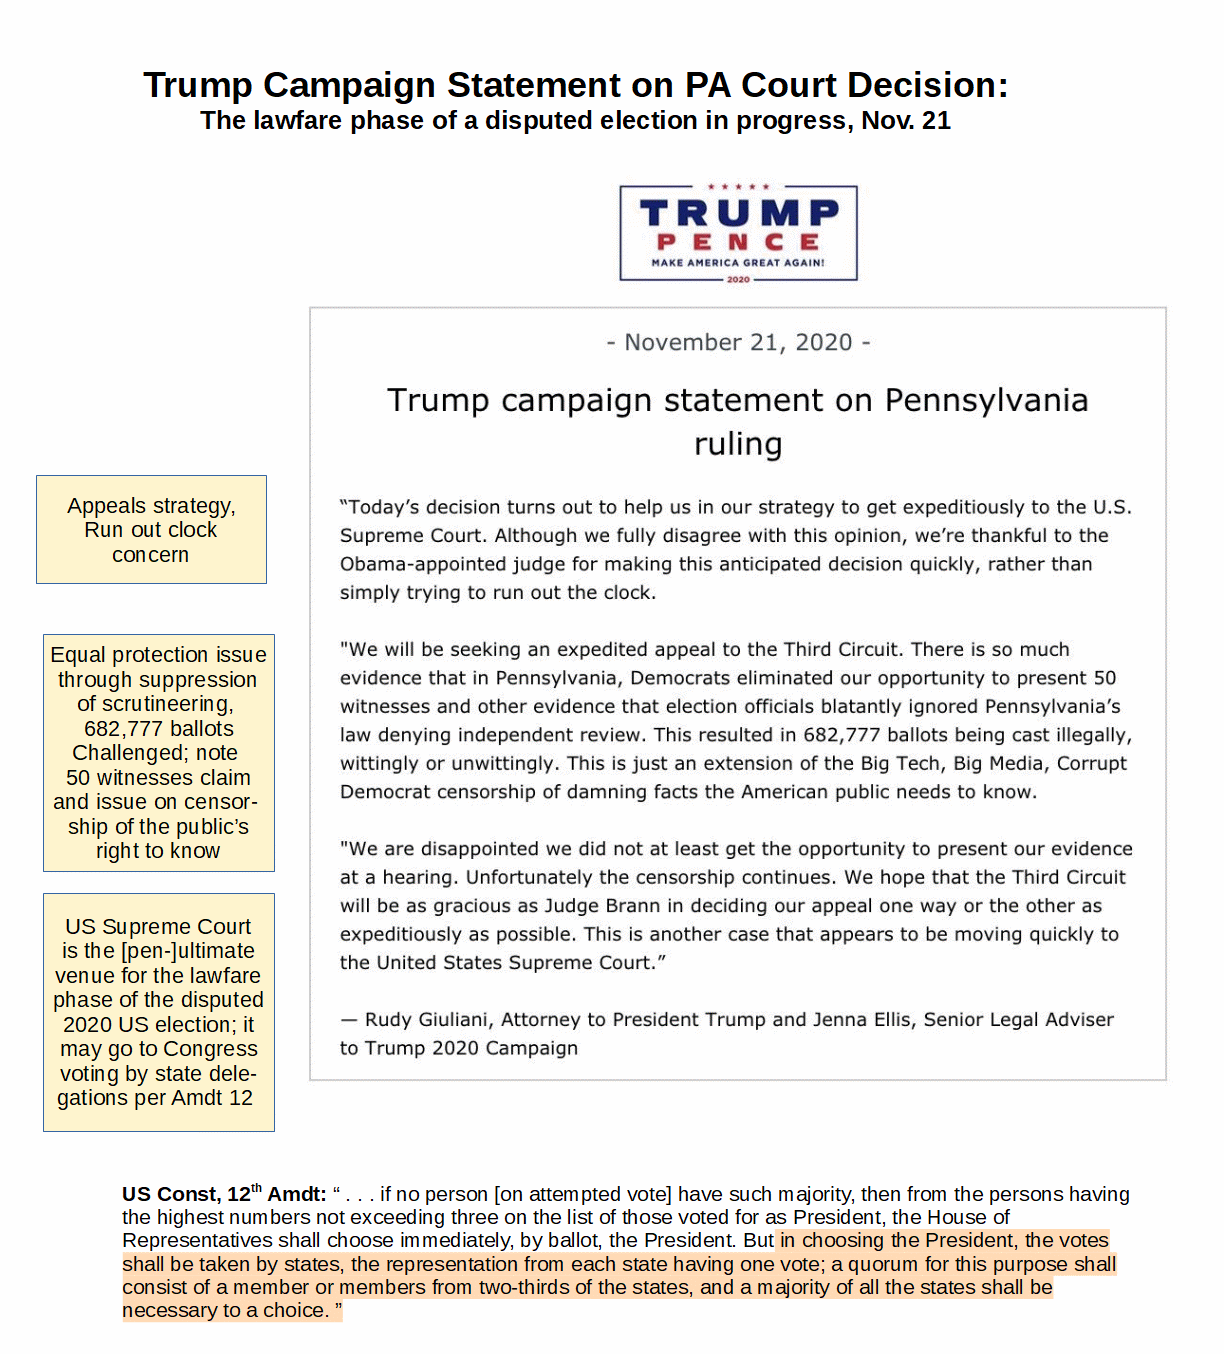
U/D23, Lawfare phase in progress:
Notice also, Ms Powell’s recent media appearance with Mr Beck:
From this, further information is to go to the media and public starting this weekend. However, it is clear that full disclosure will only happen in court. This will enable us to evaluate specific incidents and testimony as to facts, but such does not change the power of the foundational, moral duty case. I therefore clip 1351 below:
A moral duty argument.
First, all relevant officials and connected persons have a main duty to ensure integrity of elections, and know or should acknowledge the potential for fraud and what it can mean. Therefore, neglect on a systemic basis is only partly negligence, it becomes in material part a strong sign of wrongful intent. In the case of the US and a relevant party, in Feb 1994, the NYT published a front page, just below fold article [see, 1273 below] on a judge’s reversal of an election outcome and of majority in a legislature in PA, due to fraud connected to a known vulnerable type of ballot and to harvesting, intimidation etc. Ten years later in 2004, The US congress received testimony on fraud in the Ukraine [see, U/D 17 above] that further amplified such techniques. So, systemic ignorance cannot be responsibly pleaded and indeed is discredited. Accordingly there were just on these cases sixteen to twenty six years to purge the said party of such a taint, but instead this year excuse of a pandemic was taken to multiply opportunity and means for similar fraud. This is a moral duty demonstration of wrongful intent and shifts or should shift our common sense evaluation of evidence [affidavits, anomalous patterns, disturbances to counts, frustration of proper scrutineering (ponder barriers erected to block even distant observation as has been circulated by images, not just reports of witnesses), surge in vulnerable ballots, single candidate ballots etc] to recognise these as consistent with carrying out a morally demonstrated intent. This obtains whether or not sufficient weight can be amassed to lead courts to vacate suspect ballots, or whether criminal charges can be brought against leading individuals. That common sense issue is also implicated in Federalist 68, etc so state legislatures may have a duty to act in face of a tainted election. The implication, no you do not get a second round to try again, but responsible bodies take up from [and remedy] your failure can be taken as a built in deterrent effect. However moral fibre in our civilisation has long been progressively undermined for generations.
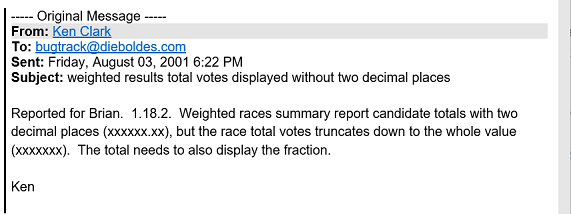
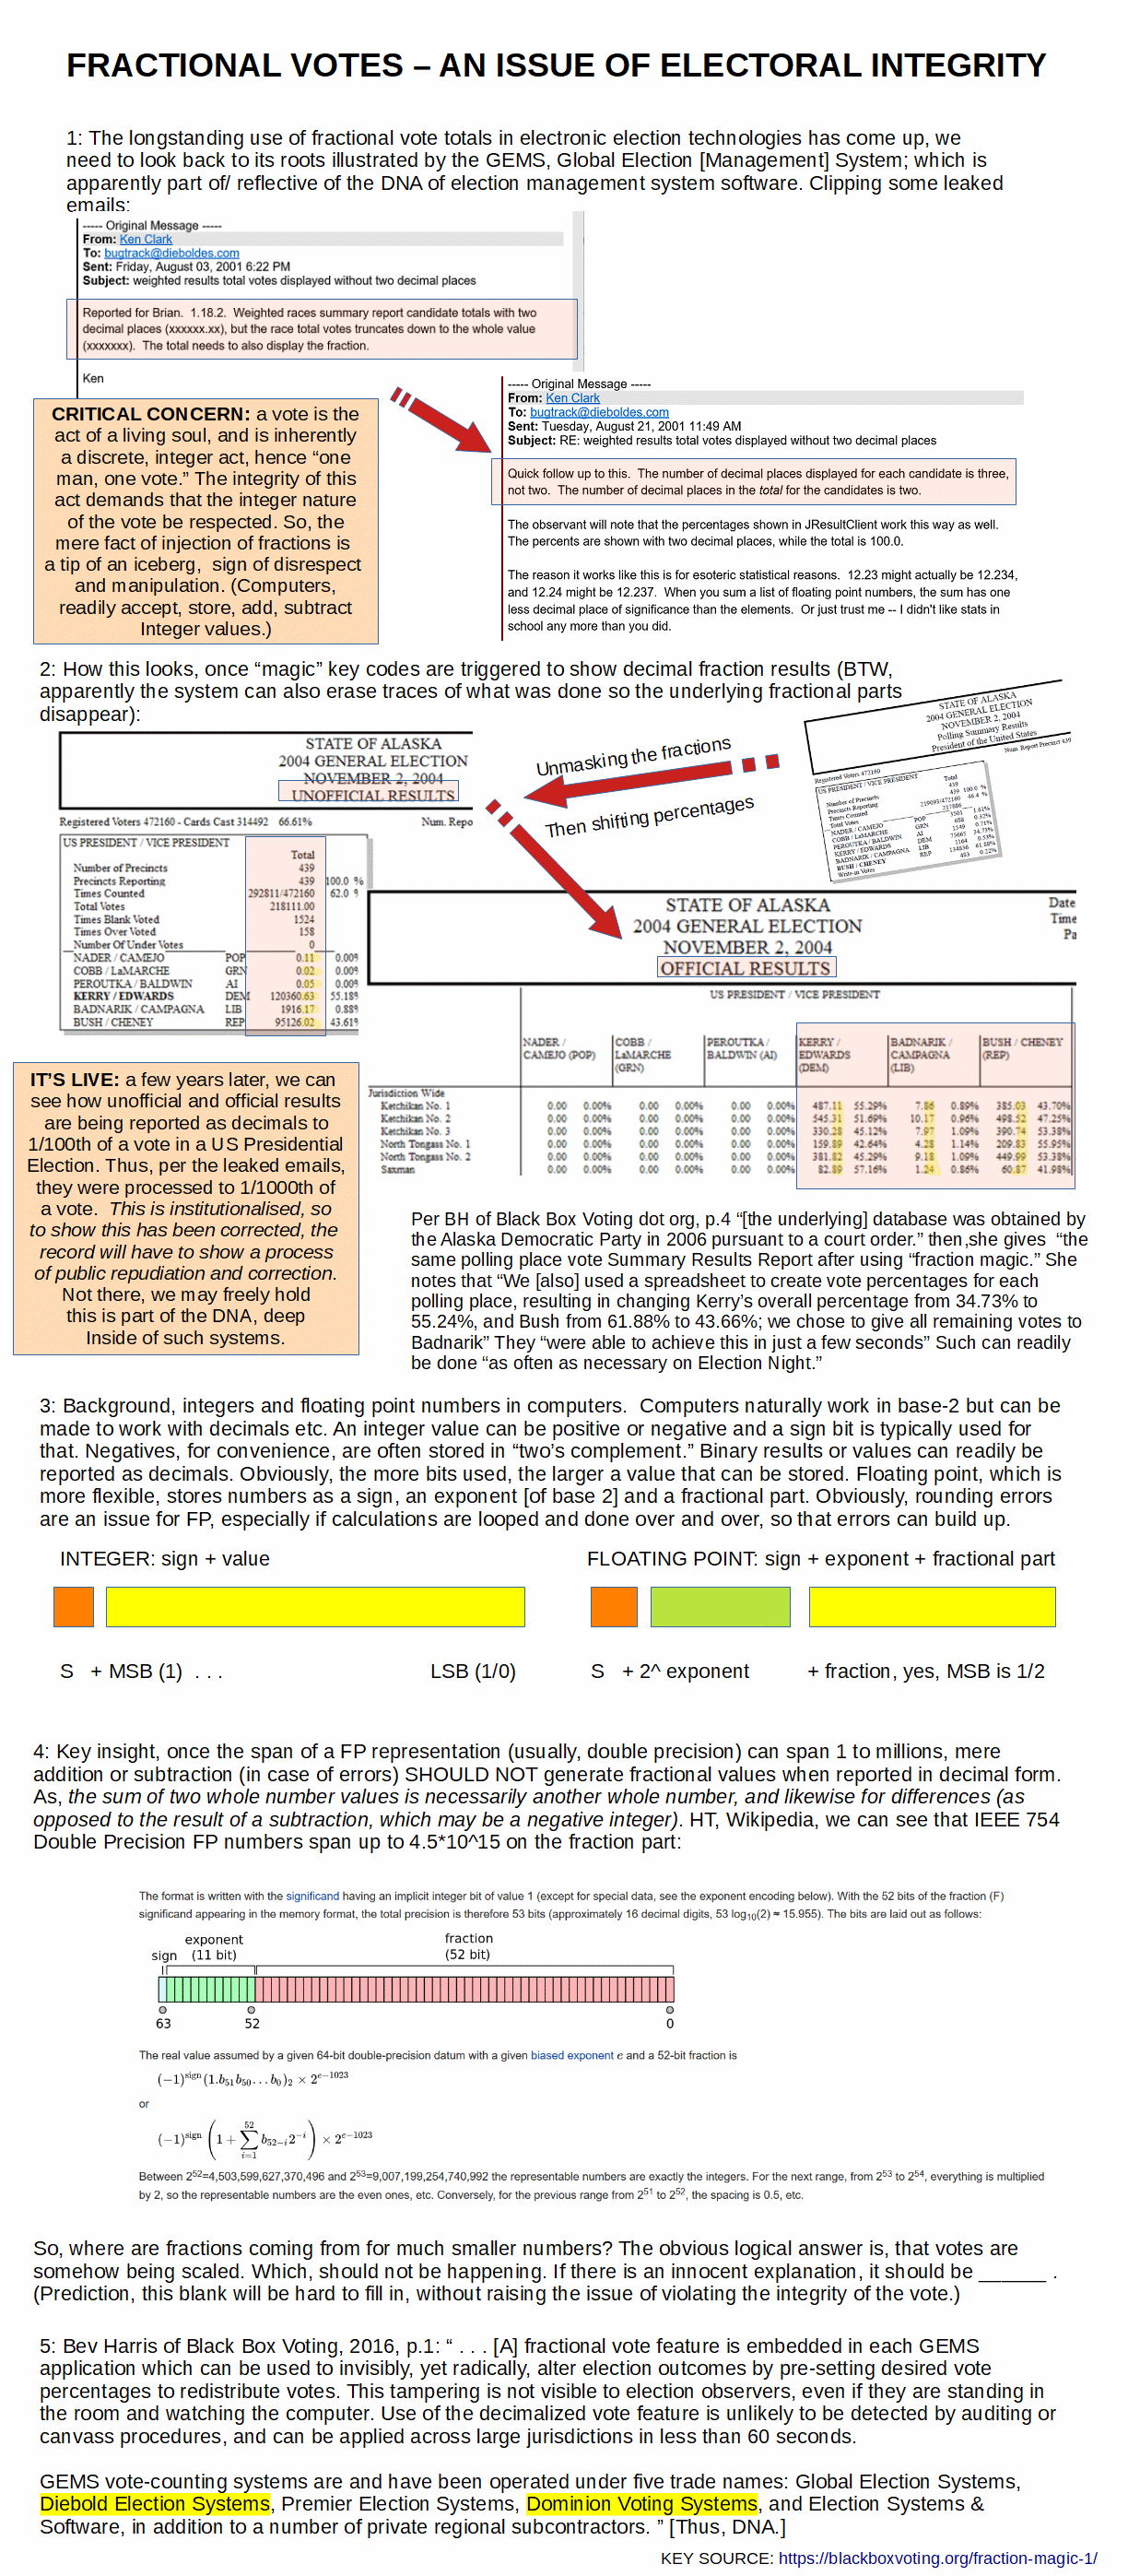
U/D24: From Blackbox voting, a leaked email on fractional votes,
U/D25, Nov 23: As this has been raised below, I augment:
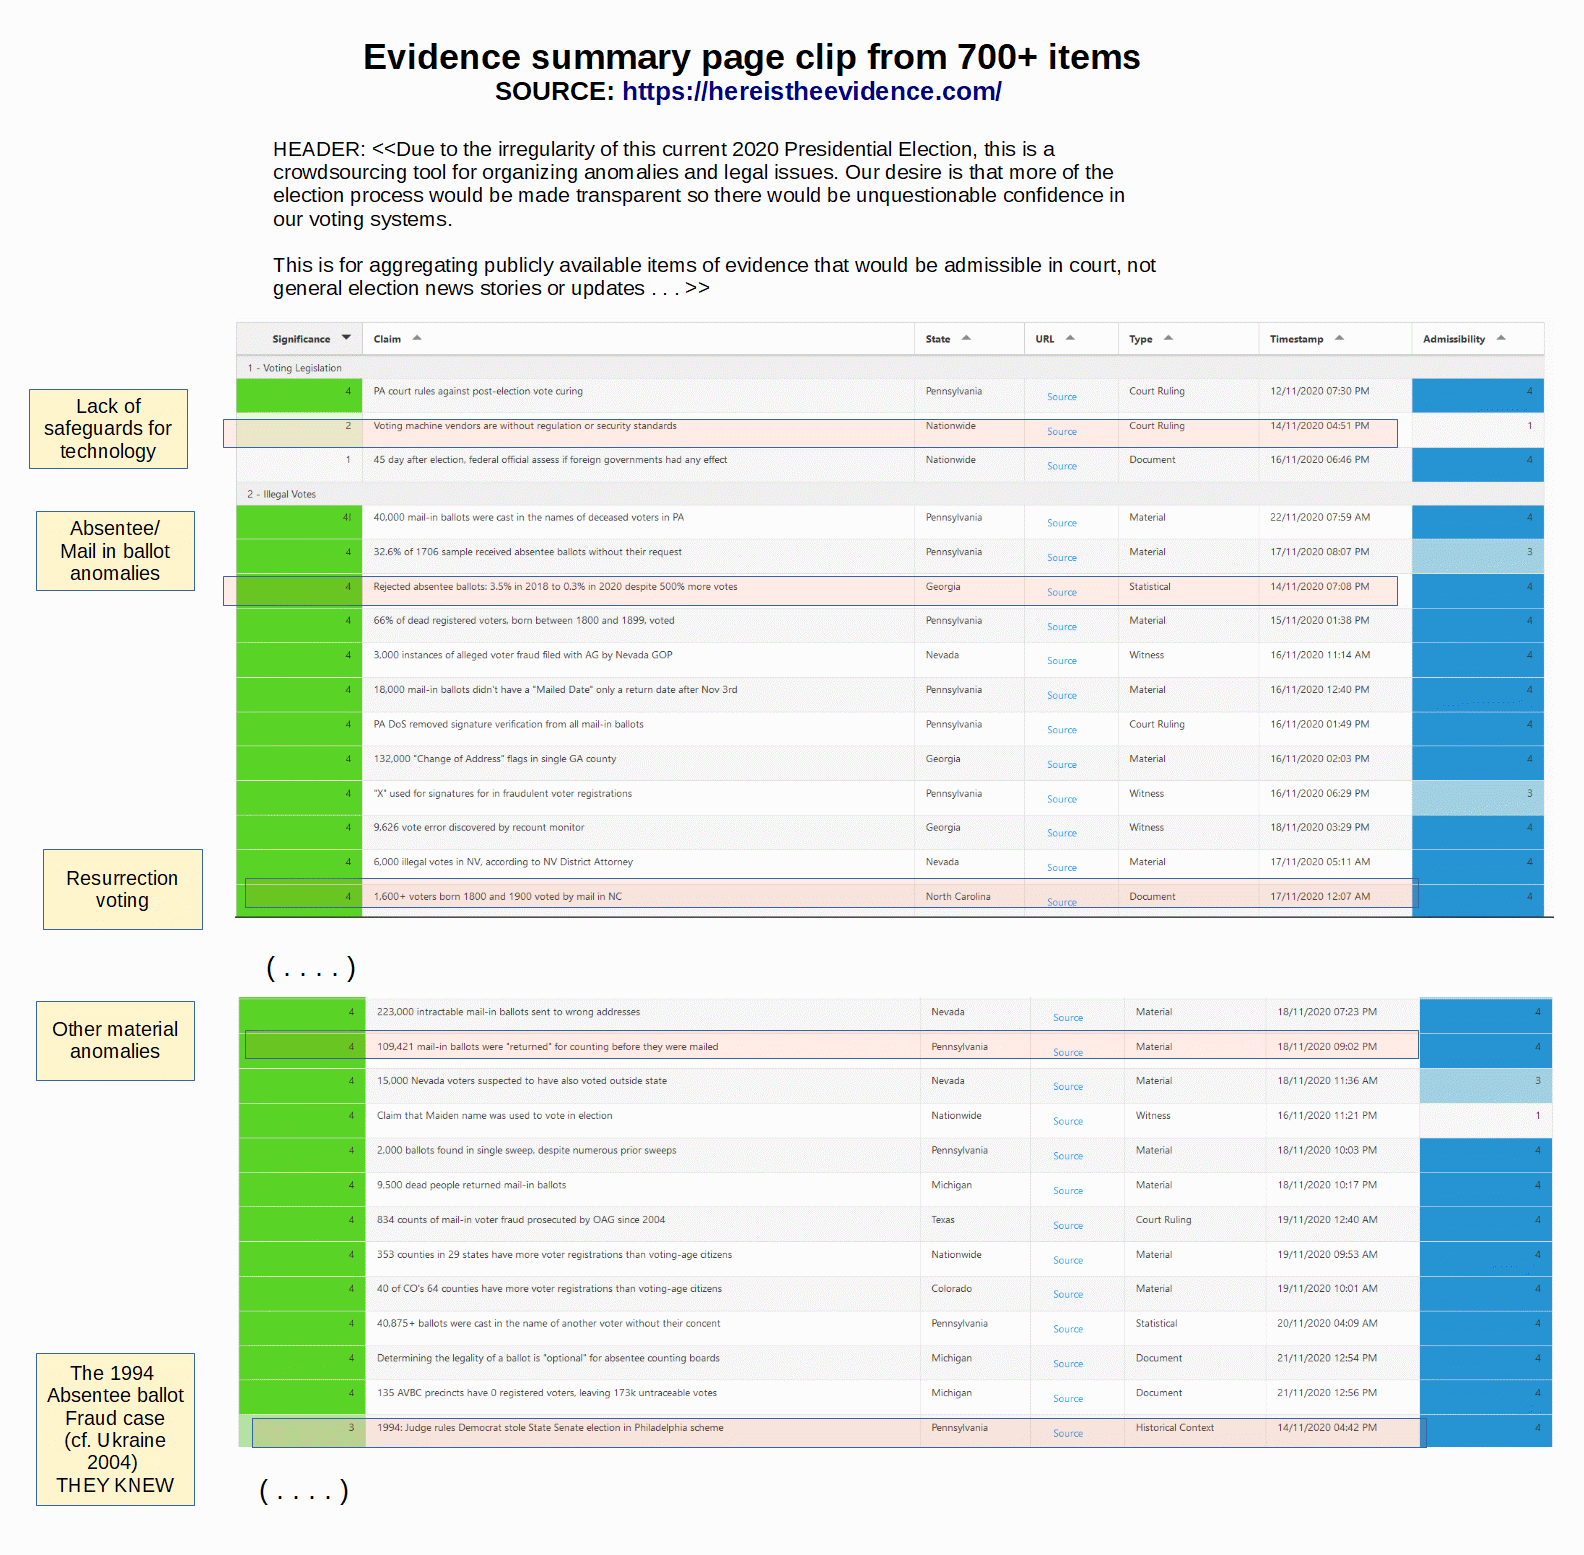
U/D26, Nov 24: H T BA 77, evidence is now being compiled here also note here at AT. Similarly, AT on Ms Powell and the Trump Team is here. I insert a clip from the evidence page:
ADDED: This 2006 CNN video on voting machines is stunning testimony against interest, pardon quality issues, this is critical evidence:
U/D27, a live observation of fractional votes where they should not be:
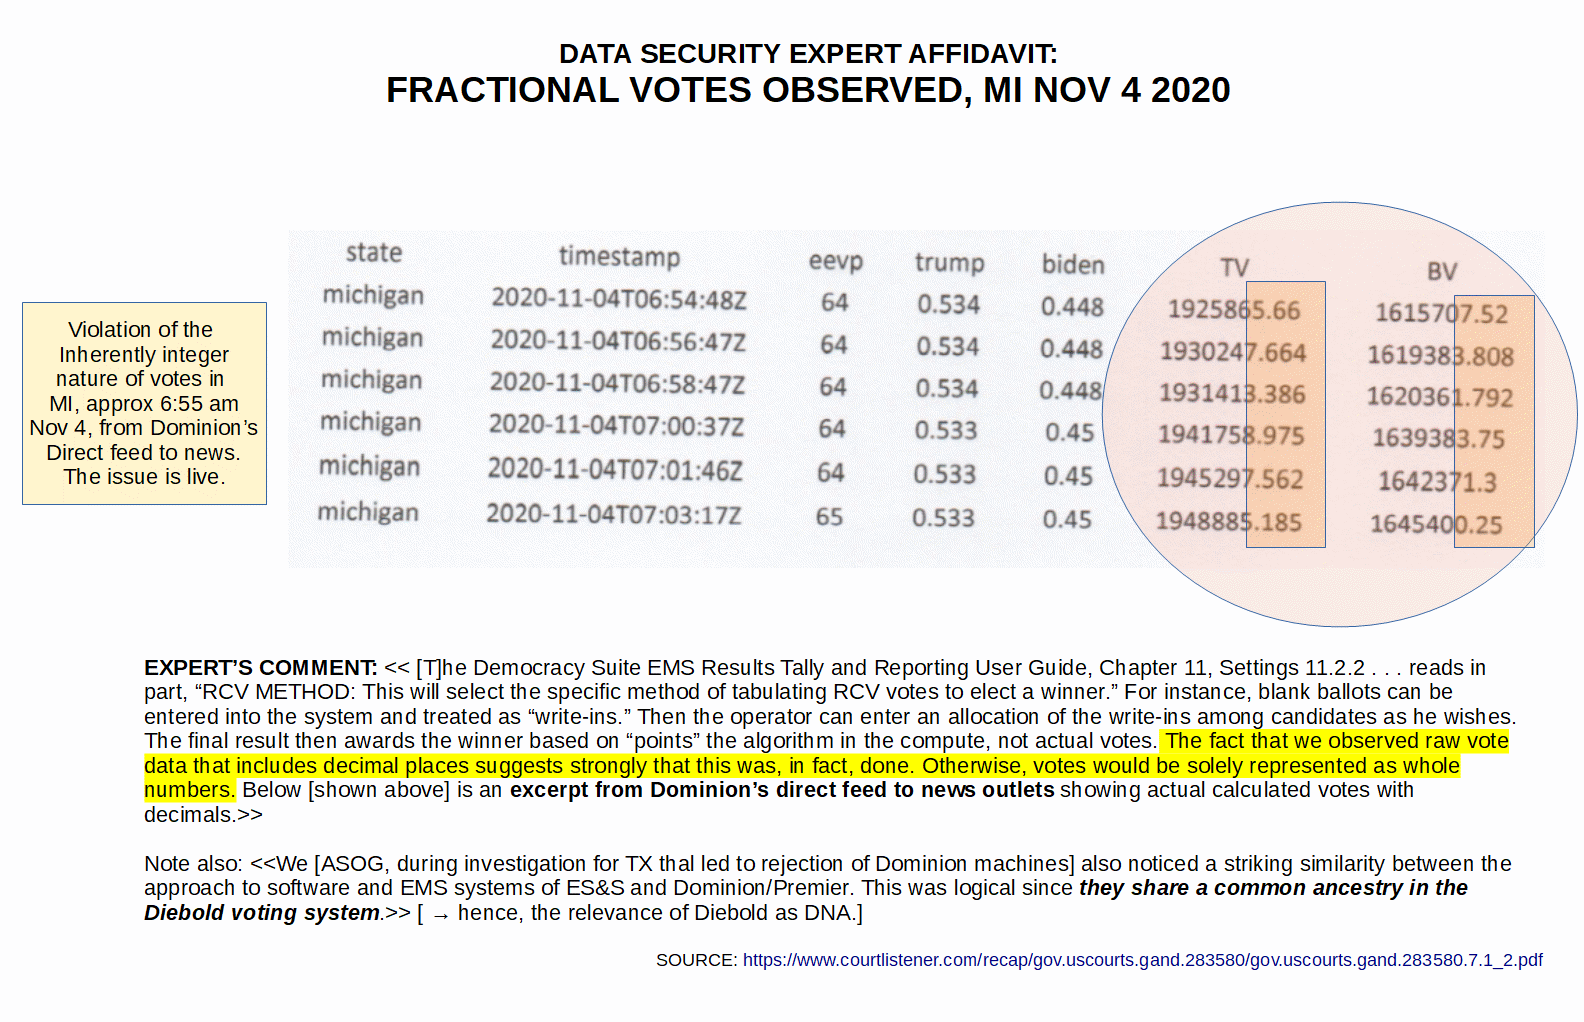
O/N: I added detail clips in 1767 below, and draw some conclusions.
O/N2: Thanks to BA77 in 1752 and Jerry in 1754, we have context for this affidavit and that in 19. There is an independent initiative following up from an election fiasco in TX in 2018, where Patrick Byrne — a tech entrepreneur who founded overstock dot com — has been funding an expert investigatory team. He warned US Homeland Security in August but was apparently brushed off; he will post findings in his own web site, so whatever happens in courts and media, this is going to the public — who will render the ultimate verdict on not only this election but on those who dominate the key “mountains of influence” of the US. Video:
U/D28: Another eyewitness from the “ground zero” counting centre in Detroit:
U/D29: A Slide summary of the Powell filings, GA & MI, cf also tabulation here. Food for thought:

U/D30: Mr Chad-man, FL, 2000 (HT, NPR):
