 Here’s a recent paper dealing with the deadly and devastating hurricane Harvey which hit the Gulf last year. I haven’t looked at very much of the paper; however, their basic take on it is that the ferocious effects of Harvey can be explained by the OHC (Ocean Heat Content) of the Gulf’s surface waters. And, of course, they want to blame ‘global warming’ (oh heavens, I should have said “climate change”). You know, more CO2 in the upper atmosphere reflects escaping heat energy back onto the ocean’s surface, causing more water vapor–the real culprit in ‘global warming.’
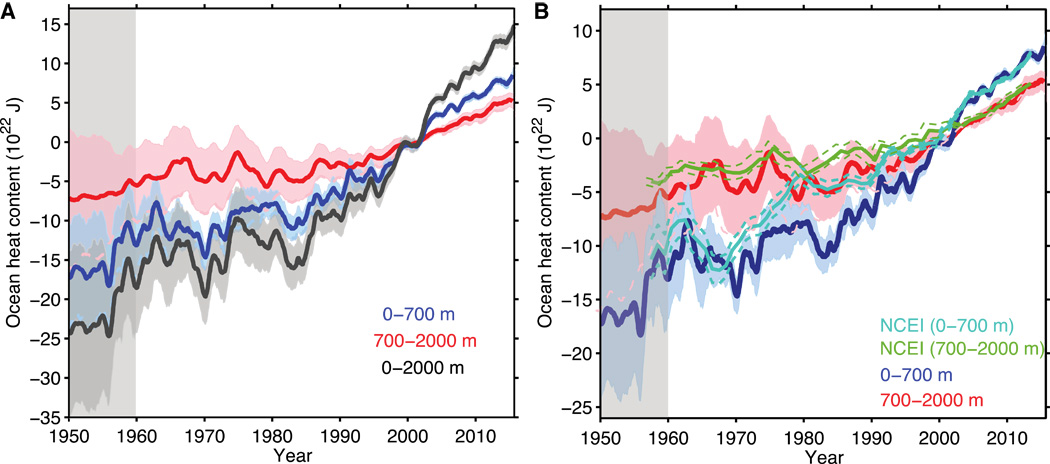
So, I simply invite you to look at Figure 1 (p 36). You will notice that the OHC calculated for ocean depths between 0 and 2000 m (6,000 ft, plus) rises constantly from 1985 on to the present.
Next, look at the middle graph, where the OHC is calculated for the upper 160 m (500 ft). There you will see that since 1985 the OHC has remained relatively STEADY!
Now, the First Law of Thermodynamics tells you that ‘heat’ transfers from a ‘hot’ reservoir to a ‘cold’ reservoir, and not vice-versa. The graphs then tell us that something other than ‘surface waters’ is ‘heating’ the deeper ocean.
What is the most obvious reason for this: greater heat coming from the earth’s core!
Simple as that. This would also account for higher CO2 levels as warmer water dissolves less CO2 than colder water.
Just look around the world: Hawaii is blowing up now; Mt. St. Helen’s blew up in . . . 1980. Iceland eruptions cancelled trans-Atlantic flights just a few years ago.
Bottom-line: simple physics tells you that while the surface temperatures in the Gulf likely added to the ferocity of Harvey, there is no way that ‘global warming/climate change’ can account for this. Figure 1 forbids it!!
So the climate scientists fail to properly interpret their own graphs! God help us.
Here’s another paper where the method of ‘calculating’ the OHC is presented (2017). Read the highlighted areas!
Global warming is driven by Earth’s energy imbalance (EEI). The EEI is likely forced to first order by a combination of greenhouse gas and aerosol
forcing, which shapes the timing and magnitude of global warming (1). It is also linked to the internal variations of the climate system and episodic volcanic eruptions; the latter may provide episodic strong radiative forcing to the Earth system (2, 3). By definition, radiative forcing is the change in the net radiative flux due to a change in an external driver of climate change, such as greenhouse gas concentrations. More than 90% of EEI is stored in the ocean, increasing ocean heat content (OHC), while the residual heat is manifest in melting of both land and sea ice, and in warming of the atmosphere and land surface (1, 4, 5). It is therefore essential to provide estimates of OHC changes over time with high confidence to improve our knowledge of EEI and its variability (4). . . .
90% of the energy imbalance is in the oceans. So why do we look up into the sky? Why don’t we try and explain why the oceans are warming. 90% in the oceans; less than 10% in the atmosphere, and yet we’re hung up on CO2 gases.
(much later in the paper)
Atlantic Ocean warming shows the largest OHC 0 to 2000 m increase
(about 3.5 times larger than the Pacific Ocean), despite having an area
only 47% as large as that of the Pacific.
This is ONLY a surprise if you believe that upper atmospheric CO2 is radiating energy back to the surface of the water; hence, a smaller surface area should mean a smaller OHC. However, if the heat is coming from the earth’s core, and since the entire mid-Atlantic trench system is one big volcano, then you would expect(!!!) the Atlantic’s OHC to be greater than the Pacific basin’s OHC.
Also, look at Figure 4 at the top of the page, which, with the ‘new’ data (left side) again shows that the deeper regions of the ocean have heated up FASTER than the surface waters. This is a complete falsification of climate change theory.
Can these scientists reason to logical results?