Uncommon Descent Serving The Intelligent Design Community

Life should be classified not as a tree but as a dependency graph, says researcher

Share
Facebook
Twitter
LinkedIn
Flipboard
Print
Email

Winston Jeffrey Ewert Winston Ewert, one of the authors of Introduction to Evolutionary Informatics has a new paper at BIO-Complexity:

Abstract: The hierarchical classification of life has been claimed as compelling evidence for universal common ancestry. However, research has uncovered much data which is not congruent with the hierarchical pattern. Nevertheless, biological data resembles a nested hierarchy sufficiently well to require an explanation. While many defenders of intelligent design dispute common descent, no alternative account of the approximate nested hierarchy pattern has been widely adopted. We present the dependency graph hypothesis as an alternative explanation, based on the technique used by software developers to reuse code among different software projects. This hypothesis postulates that different biological species share modules related by a dependency graph. We evaluate several predictions made by this model about both biological and synthetic data, finding them to be fulfilled. (open access) More.

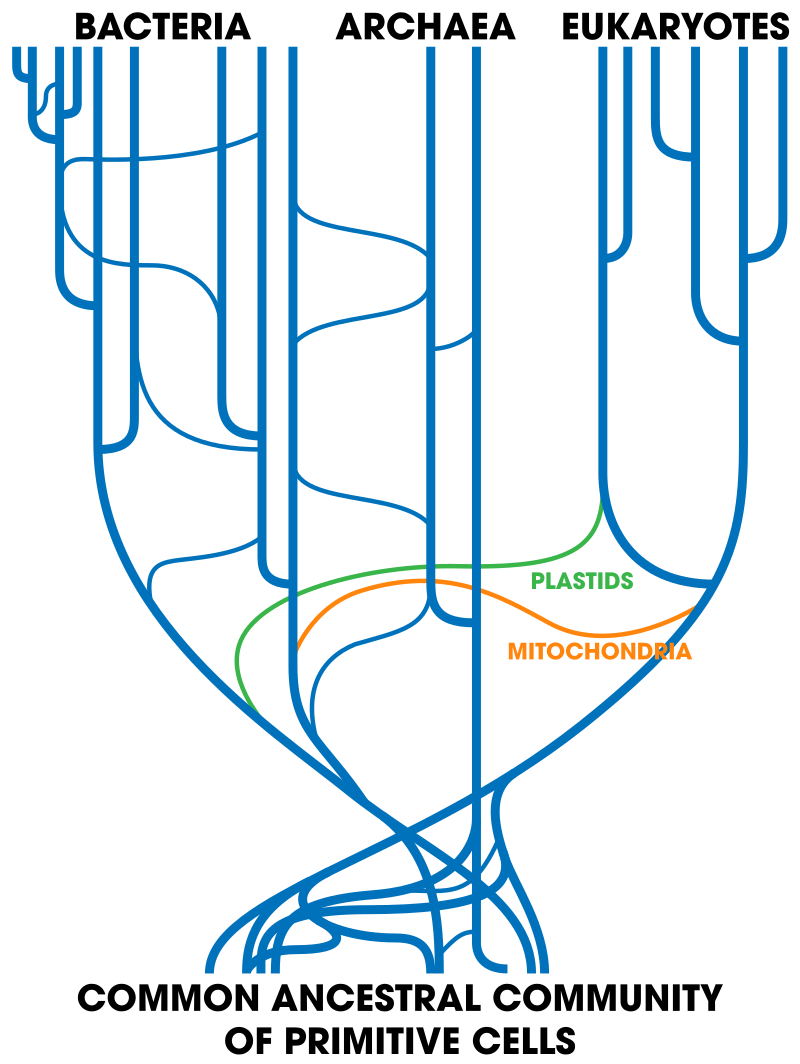
a 2005 tree of life that includes horizontal gene transfer (HGT)/Andrew Z. Colvin, Barth F. Smets, with permission

A friend offers a super-short summary:

1) Modularization is a well-established design methodology
2) Things that are developed with modularization can look as if they have a tree-like structure
3) A bayesian methodology can be used to differentiate between modularized and tree structures
4) For instances where the origins are known, the bayesian methodology correctly separates trees and modularizations
5) According to the methodology, genomes are organized more module-like than tree-like

Watch for Ewert’s work at Mind Matters Today as well, in links from here.

See also: Podcast: Winston Ewert on computer simulation of evolution (AVIDA) that sneaks in information

Dr. Ewertanswers some questions

Open Mike: Cornell OBI Conference Chapter Six – Ewert et all on the Tierra evolution program – Summary

Open Mike: Cornell OBI Conference—Chapter Three, Dembski, Ewert, and Marks on the true cost of a successful search

Also: Bill Dembski on the Evolutionary Informatics Lab – the one a Baylor dean tried to shut down

Evolutionary informatics has come a long way since a Baylor dean tried to shut down the lab

Introduction to Evolutionary Informatics: Media to get you started

Who thinks Introduction to Evolutionary Informatics should be on your summer reading list?

and

Evolutionary Informatics takes off


Comments
See also: https://en.wikipedia.org/wiki/Tree_of_life_(biology)#/media/File:Tree_of_life_by_Haeckel.jpgMung
July 22, 2018
July
07
Jul
22
22
2018
01:50 PM
1
01
50
PM
PDT
The Darwinian model is that of a tree. This ought to be without any question. Why pretend otherwise? See the Wikipedia article and the see the drawing by Darwin himself. https://en.wikipedia.org/wiki/Tree_of_life_(biology) And then you have books like this: The Tree of Life And web sites like these: http://tolweb.org/tree/ http://www.onezoom.org/ https://itol.embl.de/ Now they want to pretend like the Darwinian model is NOT a tree? Please.Mung
July 22, 2018
July
07
Jul
22
22
2018
01:48 PM
1
01
48
PM
PDT
Bob O'H to keep the main thread focused on Winston Ewert, we closed it when he left. That is out of respect for him, and we hope he will come back as he advances his effort. There is a side discussion where we can hash our your point about @sygarte. You might be right. Join us there and explain? https://discourse.peacefulscience.org/t/side-comments-on-the-dependency-graph-of-life/743 Also, there is unfortunate confusion about evolution here. Common descent does not predict that data will fall perfectly in nested clades. Common descent does not produce DNA that falls into a tree. This is well known by experts, but "popularizers" have been wrong. So Ewert's might be understood to dispatch a cartoon version of evolution. This has nothing to do with evolution as understood in mainstream science.Prof. S. Joshua Swamidass
July 22, 2018
July
07
Jul
22
22
2018
01:20 PM
1
01
20
PM
PDT
Mung:
The Darwinian model is that of a tree.
That depends on your definition of "tree". ;) If you want to get technical then divergence would expect patterns as diverse as every population would represent a bifurcating node to a chain of being. Just think how messy the diagram of every population depicted that way- as a bifurcating node. As a reference in the diagram in the OP the lines of descent contain thousands to millions of populations that need to be made into a bifurcating nodes. Messy. Very. Quickly. So evos simplify to try to fool the masses and unfortunately it has worked.ET
July 22, 2018
July
07
Jul
22
22
2018
12:34 PM
12
12
34
PM
PDT
@Mung, yes I agree. While the tone is much more cordial than the skeptic zone, it is also condescending. Dr. Ewert's paper is well argued and he added many qualifications to minimize his claims. He has the necessary credentials and expertise for the methods he used. So, Dr. Ewert's paper should be received as one would receive any other serious researcher. Not as if Dr. Swamidass is the gatekeeper to the scientific world, and he is allowing Dr. Ewert into the fold.EricMH
July 22, 2018
July
07
Jul
22
22
2018
11:17 AM
11
11
17
AM
PDT
Mung @ 13 - No, the graph is directed (as time only goes in one direction). But it's bifurcating, i.e. each node (except the root) has one edge going to it, and 2 leaving it.Bob O'H
July 22, 2018
July
07
Jul
22
22
2018
10:20 AM
10
10
20
AM
PDT
But let's be honest. The Darwinian model is that of a tree. If that has changed it would sure be nice to know when and why. Perhaps the evidence didn't fit the model and scientists are having to face the facts.Mung
July 22, 2018
July
07
Jul
22
22
2018
09:33 AM
9
09
33
AM
PDT
EricMH:
What sort of graph would descent with modification create?
Perhaps an undirected dependency graph.Mung
July 22, 2018
July
07
Jul
22
22
2018
09:26 AM
9
09
26
AM
PDT
Joshua Swamidass, I do not care for your approach towards Winston as someone who is dishonest and needs to gain your trust.Mung
July 22, 2018
July
07
Jul
22
22
2018
09:25 AM
9
09
25
AM
PDT
Thanks for setting up a dialogue, but it would help if you didn't then close it! The discussion started by sygarte on Table 4 contains several mis-understandings of what Bayes Factors are. FWIW, when I saw Table 4 my reaction was that the values are barely plausible: some are several orders of magnitude larger than any other (log-)Bayes Factor I've seen.Bob O'H
July 22, 2018
July
07
Jul
22
22
2018
09:09 AM
9
09
09
AM
PDT
I'm please to report a dialogue (and critique) of this paper at: https://discourse.peacefulscience.org/t/winston-ewert-the-dependency-graph-of-life/728 You are welcome to join the conversation. Peace.Prof. S. Joshua Swamidass
July 21, 2018
July
07
Jul
21
21
2018
07:15 PM
7
07
15
PM
PDT
What sort of graph would descent with modification create? Unless you have species materializing out of nothing and converging into a single species, you have a tree. Perhaps a tree with a couple roots if life started in a couple different places. The core of evolution, whether Darwinian or theistic, is common descent with modification. Common descent necessitates a tree model. Dr. Ewert has decisively refuted the tree model. Therefore, evolution of every flavor is kaput.EricMH
July 21, 2018
July
07
Jul
21
21
2018
05:31 PM
5
05
31
PM
PDT
Darwin never said that descent with modification predicts any tree or nested hierarchy. What Darwin said that was his mechanisms could also account for/ explain (away) the observed pattern- the pattern Linnaeus attributed to a Common Design. As Drs Mayr and Simpson said decades ago:
“One would expect a priori that such a complete change of the philosophical bias of classification would result in a radical change of classification, but this was by no means the case. There was hardly and change in method before and after Darwin, except that "archetype" was replaced by the common ancestor.”-- Ernst Mayr
“From their classifications alone, it is practically impossible to tell whether zoologists of the middle decades of the nineteenth century were evolutionists or not. The common ancestor was at first, and in most cases, just as hypothetical as the archetype, and the methods of inference were much the same for both, so that classification continued to develop with no immediate evidence of the revolution in principles….the hierarchy looked the same as before even if it meant something totally different.” - G. Simpson
ET
July 21, 2018
July
07
Jul
21
21
2018
07:45 AM
7
07
45
AM
PDT
Dr. Cornelius Hunter broke down the the numbers in Ewert's paper and put is in proper perspective: Common Descent or Design? Which model best explains the genetic data?
New Paper by Winston Ewert Demonstrates Superiority of Design Model - Cornelius Hunter - July 20, 2018 Excerpt: Ewert’s three types of data are: (i) sample computer software, (ii) simulated species data generated from evolutionary/common descent computer algorithms, and (iii) actual, real species data. Ewert’s three models are: (i) a null model which entails no relationships between any species, (ii) an evolutionary/common descent model, and (iii) a dependency graph model. Ewert’s results are a Copernican Revolution moment. First, for the sample computer software data, not surprisingly the null model performed poorly. Computer software is highly organized, and there are relationships between different computer programs, and how they draw from foundational software libraries. But comparing the common descent and dependency graph models, the latter performs far better at modeling the software “species.” In other words, the design and development of computer software is far better described and modeled by a dependency graph than by a common descent tree. Second, for the simulated species data generated with a common descent algorithm, it is not surprising that the common descent model was far superior to the dependency graph. That would be true by definition, and serves to validate Ewert’s approach. Common descent is the best model for the data generated by a common descent process. Third, for the actual, real species data, the dependency graph model is astronomically superior compared to the common descent model. Where It Counts Let me repeat that in case the point did not sink in. Where it counted, common descent failed compared to the dependency graph model. The other data types served as useful checks, but for the data that mattered — the actual, real, biological species data — the results were unambiguous. Ewert amassed a total of nine massive genetic databases. In every single one, without exception, the dependency graph model surpassed common descent. Darwin could never have even dreamt of a test on such a massive scale. Darwin also could never have dreamt of the sheer magnitude of the failure of his theory. Because you see, Ewert’s results do not reveal two competitive models with one model edging out the other. We are not talking about a few decimal points difference. For one of the data sets (HomoloGene), the dependency graph model was superior to common descent by a factor of 10,064. The comparison of the two models yielded a preference for the dependency graph model of greater than ten thousand. Ten thousand is a big number. But it gets worse, much worse. Ewert used Bayesian model selection which compares the probability of the data set given the hypothetical models. In other words, given the model (dependency graph or common descent), what is the probability of this particular data set? Bayesian model selection compares the two models by dividing these two conditional probabilities. The so-called Bayes factor is the quotient yielded by this division. The problem is that the common descent model is so incredibly inferior to the dependency graph model that the Bayes factor cannot be typed out. In other words, the probability of the data set, given the dependency graph model, is so much greater than the probability of the data set given the common descent model, that we cannot type the quotient of their division. Instead, Ewert reports the logarithm of the number. Remember logarithms? Remember how 2 really means 100, 3 means 1,000, and so forth? Unbelievably, the 10,064 value is the logarithm (base value of 2) of the quotient! In other words, the probability of the data on the dependency graph model is so much greater than that given the common descent model, we need logarithms even to type it out. If you tried to type out the plain number, you would have to type a 1 followed by more than 3,000 zeros. That’s the ratio of how probable the data are on these two models! By using a base value of 2 in the logarithm we express the Bayes factor in bits. So the conditional probability for the dependency graph model has a 10,064 advantage over that of common descent. 10,064 bits is far, far from the range in which one might actually consider the lesser model. See, for example, the Bayes factor Wikipedia page, which explains that a Bayes factor of 3.3 bits provides “substantial” evidence for a model, 5.0 bits provides “strong” evidence, and 6.6 bits provides “decisive” evidence. This is ridiculous. 6.6 bits is considered to provide “decisive” evidence, and when the dependency graph model case is compared to comment descent case, we get 10,064 bits. But It Gets Worse The problem with all of this is that the Bayes factor of 10,064 bits for the HomoloGene data set is the very best case for common descent. For the other eight data sets, the Bayes factors range from 40,967 to 515,450. In other words, while 6.6 bits would be considered to provide “decisive” evidence for the dependency graph model, the actual, real, biological data provide Bayes factors of 10,064 on up to 515,450. We have known for a long time that common descent has failed hard. In Ewert’s new paper, we now have detailed, quantitative results demonstrating this. And Ewert provides a new model, with a far superior fit to the data. https://evolutionnews.org/2018/07/new-paper-by-winston-ewert-demonstrates-superiority-of-design-model/
bornagain77
July 21, 2018
July
07
Jul
21
21
2018
05:19 AM
5
05
19
AM
PDT
Here's the PDF paper referenced by BA77 @2 ... by Stoeckle M.Y., Program for the Human Environment The Rockefeller University. by Thaler D.S., Biozentrum, University of Basel https://phe.rockefeller.edu/news/wp-content/uploads/2018/05/Stoeckle-Thaler-Final-reduced.pdf They include an interesting history of COI Barcoding and Skeptic's viewpoints at beginning of the paper.
Skeptics of COI barcoding [8] raised a number of objections about its power and/or generality as a single simple metric applicable to the entire animal kingdom, including: 1) the small fraction of the genome (about 5% of the mitochondrial genome and less than one millionth of the total organism’s genome) might not be sensitive or representative [9, 10]; 2) since animal mitochondria are inherited maternally the apparent pattern of speciation from mitochondria is vulnerable to distortion when females and males roam differently [11]; 3) the mitochondrial chromosome is subject to types of selection not WHY SHOULD MITOCHONDRIA DEFINE SPECIES? 3 experienced by the nuclear genome [12]: replicon competition within each organelle [13], among organelles inside each cell [14-16], including differential segregation of organelles at cell division [17]; and 4) mitochondria in some groups are sensitive to agents such as Wolbachia that are not known to affect nuclear genes [18]. Mitochondrial pseudogenes in the nucleus sometimes confused analysis [19]. Anecdotally, some domain experts felt that only specialists can reliably recognize species in each group and that “DNA taxonomy” was felt as necessarily inferior or a threat. The current field of COI barcodes is no longer fragile but neither is it complete. As of late 2016 there were close to five million COI barcodes between the GenBank and BOLD databases. Objections can now be seen in the cumulative light of these data and more than a decade’s experience. There is no longer any doubt that DNA barcodes are useful and practical (Figs. 1,2). The agreement with specialists encompasses most cases in several important animal domains. Many cases where DNA barcodes and domain specialists do not agree reflect geographic splits within species or hybridization between species. Others upon further investigation been attributed to mislabeling or sequence error [20]. Some may represent bona fide exceptions to the rule that mitochondrial sequence clusters coincide with species defined by other means. In the great majority of cases COI barcodes yield a close approximation of what specialists come up with after a lot of study. Birds are one of the best characterized of all animal groups and COI barcode clusters have been tabulated as agreeing with expert taxonomy for 94% of species [21].
I guess a good question is how might this research of COI Barcode information findings confirm or enhance Ewert's approach of Dependency Graphs vs that of the long-held consensus TOL? And another intriguing question is, does this study by Thaler and Stoeckle align with Gould's Punctuated Equilibrium? If so, then does the hypothesis by Ewert align as better heuristic for research than blind, random, Darwinian gradualism?DATCG
July 20, 2018
July
07
Jul
20
20
2018
10:52 PM
10
10
52
PM
PDT
BA77 @2, Thanks for those links. from 1st link...
"The answer is no," said Stoeckle, lead author of the study, published in the journal Human Evolution. For the planet's 7.6 billion people, 500 million house sparrows, or 100,000 sandpipers, genetic diversity "is about the same," he told AFP. The study's most startling result, perhaps, is that nine out of 10 species on Earth today, including humans, came into being 100,000 to 200,000 years ago. "This conclusion is very surprising, and I fought against it as hard as I could," Thaler told AFP.
Highlighting one of your quotes... "The absence of "in-between" species is something that also perplexed Darwin, he said." Essentially nothing has changed? Still no closer to an unguided, blind explanation than when Darwin lived?DATCG
July 20, 2018
July
07
Jul
20
20
2018
10:28 PM
10
10
28
PM
PDT
Nevertheless, biological data resembles a nested hierarchy sufficiently well to require an explanation. While many defenders of intelligent design dispute common descent, no alternative account of the approximate nested hierarchy pattern has been widely adopted.
1- I doubt that Winston understands what a nested hierarchy entails. Evolutionists don't. 2- Linnaean taxonomy is a nested hierarchy and it was based on a common designET
July 20, 2018
July
07
Jul
20
20
2018
04:39 PM
4
04
39
PM
PDT
This can't possibly be an ID paper. I smell a hoax.Mung
July 20, 2018
July
07
Jul
20
20
2018
06:34 AM
6
06
34
AM
PDT
Of somewhat related interest is this recent finding:
Sweeping gene survey reveals new facets of evolution – May 28, 2018 Excerpt: Darwin perplexed,,, And yet—another unexpected finding from the study—species have very clear genetic boundaries, and there’s nothing much in between. “If individuals are stars, then species are galaxies,” said Thaler. “They are compact clusters in the vastness of empty sequence space.” The absence of “in-between” species is something that also perplexed Darwin, he said. https://phys.org/news/2018-05-gene-survey-reveals-facets-evolution.html Why should mitochondria define species? - 2018 Excerpt: The particular mitochondrial sequence that has become the most widely used, the 648 base pair (bp) segment of the gene encoding mitochondrial cytochrome c oxidase subunit I (COI),,,, The pattern of life seen in barcodes is a commensurable whole made from thousands of individual studies that together yield a generalization. The clustering of barcodes has two equally important features: 1) the variance within clusters is low, and 2) the sequence gap among clusters is empty, i.e., intermediates are not found.,,, https://phe.rockefeller.edu/news/wp-content/uploads/2018/05/Stoeckle-Thaler-Final-reduced.pdf
The preceding study, in over the top fashion, also confirms what Michael Denton had found over 30 years ago in his book “Evolution: A Theory in Crisis”. Specifically, “However, the most striking feature of the matrix is that every identifiable subclass is isolated and distinct. Every sequence can be unambiguously assigned to a particular subclass. No sequence or group of sequences can be designated as intermediate with respect to other groups. All the sequences of each subclass are equally isolated from the members of another group. Transitional or intermediate classes are completely absent from the matrix. 4”
Cytochrome C Excerpt: If the existence of cytochrome C in “higher forms” of animals is the result of evolution from a common ancestor, then one would expect to see a logical progression. That is, the cytochrome C of an invertebrate (like a worm) would be slightly different from a bacteria. A “primitive” vertebrate (like a fish) would have those same differences, plus a few more. As you progress along the presumed evolutionary path to amphibians, reptiles, mammals, primates, ending with humans, you should see the changes in cytochrome C accumulate. On the other hand, if cytochrome C is a commonly used component employed by a designer, you will not see that logical progression. You will just see minor differences which optimize cytochrome C for that kind of creature.,,, There is a way to distinguish evolution from design at the molecular level. Molecular biologist Michael Denton examined the molecular evidence in detail. He said,,, Dr. Denton then produced several tables and diagrams that show this. He showed, for example, that the cytochrome C in bacteria is 64% different from horses and pigeons, 65% different from tuna and silkmoths, 66% different from wheat, and 69% different from yeast. 2 He left it to the reader to realize that, according to evolutionary theory, one would expect the cytochrome C of a bacterium to be closer to the cytochrome C of a tuna (fish) than a horse (mammal). Furthermore, the horse should have the same mutations as the tuna, plus a few more. This is not what the molecular data shows.,,, Dr. Denton’s Figure 12.1, “The Cytochromes Percent Sequence Difference Matrix” 3, is an abridged version of the 1972 Dayhoff Atlas of Protein Structure and Function Matrix of nearly 1089 entries showing the percent difference between 33 species. Denton’s abridged matrix shows that molecular biologists can easily recognize which cytochrome C sample came from a fish and which came from a mammal. “However, the most striking feature of the matrix is that every identifiable subclass is isolated and distinct. Every sequence can be unambiguously assigned to a particular subclass. No sequence or group of sequences can be designated as intermediate with respect to other groups. All the sequences of each subclass are equally isolated from the members of another group. Transitional or intermediate classes are completely absent from the matrix. 4” If evolution were true, and creatures gradually evolved from one to another, there should be intermediate forms. Intermediate forms should be found in living creatures, in the fossil record, and in proteins. It should, in at least some cases, be hard to classify things because the boundaries are blurred. (But the boundaries are distinct as would be expected under the Design presupposition) http://scienceagainstevolution.info/v7i10f.htm
bornagain77
July 20, 2018
July
07
Jul
20
20
2018
03:38 AM
3
03
38
AM
PDT
This is great to see! Congrats to Ewert and Bio-Complexity on this new research concept and paper. And to JohnnyB as Editor. For being bold enough to think outside of Darwin's box :) And thanks to all at Discovery Institute for all the work they do. So glad to see this approach taking form. I know it's just at the beginning of hashing out concepts, ideas and more details. I think this is the correct approach for reverse-engineering the Code(s) of Life. Looking forward to reading through it.
For example, see “echolocation” and “marine” in Figure 3. All marine species depend on a marine module, and the echolocating species depend on the echolocation module. The dependency graph is essentially a tree with extra flexibility; the modules can explain genes shared between species thought to be only distantly related by common descent. A module is not restricted to reusing code from a single source, but can freely reuse from multiple sources. Compare this to common descent where each species must almost exclusively draw from a single source: its ancestral species. If the true explanation for life’s pattern of reuse is the dependency graph, why has it been interpreted as a nested hierarchy? According to the dependency graph hypothesis, the tree is simply a subset of the true dependency graph. Attempts to determine the correct tree of life have simply been uncovering the tree which best approximates the entire dependency graph.
Well said.
This works because some modules contribute much more similarity to species which depend on them than others. Life resembles a nested hierarchy because a nested hierarchical structure is similar enough to a dependency graph structure to approximate it. However, while the nested hierarchy structure resembles a dependency graph it is not exactly the same. The dependency graph hypothesis does not simply predict the same pattern as common descent, nor common descent with unspecified deviations from the general pattern. Instead, it predicts instances of module reuse across taxonomic boundaries. Examples include the molecular convergence found in echolocating mammals [26] or marine mammals [27, 28]. Others have argued that mammals in general show a similar level of convergence [29, 30]. Moreover, virtually all sequenced genomes contain genes which have been interpreted as having arrived by horizontal gene transfer due to not fitting the hierarchical pattern [8, 11, 12, 31]. If the dependency graph hypothesis is correct, we should expect to find numerous examples of modules that appear to have been reused across taxonomic boundaries. The dependency graph hypothesis draws on the idea of common design, by having reusable modules, as well as functional requirements, by restricting the reuse of modules via the dependency graph. The concept of a dependency graph draws not from an ad-hoc attempt to explain the data, but the actual process used to develop software. It is based on behaviors and practices that intelligent agents are known to use, not simply processes necessary to explain the data.
DATCG
July 20, 2018
July
07
Jul
20
20
2018
12:55 AM
12
12
55
AM
PDT
1 2

Leave a Reply