Uncommon Descent Serving The Intelligent Design Community

Pop Quiz for Climatistas

Share
Facebook
Twitter
LinkedIn
Flipboard
Print
Email

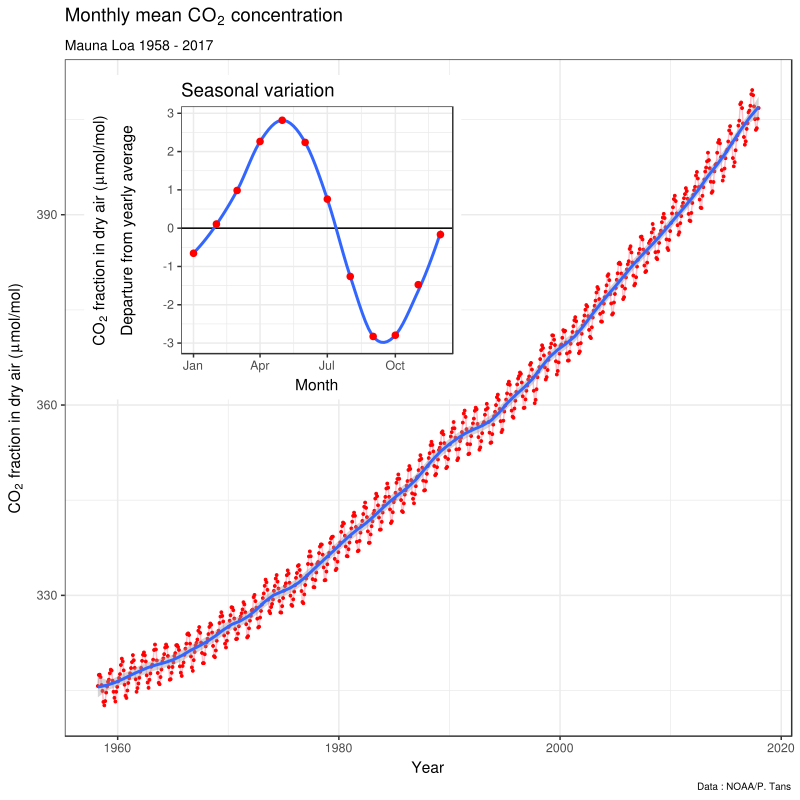
I wonder what you make of this “Keeling Curve.” I especially wonder what you make of the inset–which can be seen to oscillate on the actual graph of this ‘curve’ below the inset.

This might be a very teachable moment.

I await your brilliant responses.
Comments
In related news James Cook University @jcu censures a climate skeptic – help him fight back It looks like one scientist dared to challenge the science behind the alleged demise of the Great Barrier Reef and is now paying a heavy price for that. ET
"IOW, if you increase the population of plankton by 4%, I don’t see how this increased population size wouldn’t absorb man-made emissions. " CO2 is not a limiting nutrient in the world's oceans. The size of the phytoplankton populations, and therefore the amount of CO2 that they can convert to biomass, is not dependent on the CO2 concentration. It is dependent on nitrogen and/or phosphorus. So, unless you want to increase the amount of raw sewage that we dump into the oceans, which will cause all sorts of other problems, the amount of CO2 that the oceans can process is finite. Molson Bleu
Molson Bleu: I looked at the link, and the 14C distinction revolves around the "age of the atmosphere," and isn't, as I see it, a reliable way of distinguishing between "fossil fuel" carbon, and natural and man-made sources of 14C. If you invoke the 13C differences, this acknowledges that plants and trees around the world are actually absorbing fossil fuel generated carbon, which was part of my argument regarding the equilibrium equations involved in a sink/source dynamic. My sense in looking around, is that the most important and critical form of photosynthesis takes place ocean-born populations of phytoplankton and zooplankton. The size of these populations has all kinds of things that affect it. So, I can see a scenario in which these populations could easily increase in size. IOW, if you increase the population of plankton by 4%, I don't see how this increased population size wouldn't absorb man-made emissions. So, it's hard to reach conclusions about just what is going on. There are many factors at play, with all of this ending up being quite complex. Our climate models might then, at most, represent our best guess. Should we 'bet' trillions of dollars on this? The corparate giants around the world answer, "yes." Caution is due. PaV
The question in light of the study posted above @66 on 20% decline. Did Mauna Loa show similar decline during that period?
I too would like to know more about this. The paper is way too technical for me, but the linked phys.org article states:
But the scientists found that between 2002 and 2014, the rate at which CO2 increased in the atmosphere held steady at about 1.9 ppm/year.
Eyeballing the graph in the OP, the blue curve is indeed quite straight between 2002 and 2014 (and is even slightly concave-down), as opposed to its concave-up behavior on average. daveS
So the Warmers entire case rests on what they can scare you into, when the truth is the relationship between C02 and the weather system is not well-understood, to say the least. Andrew asauber
Speaking of C02... "No matter what happens, cold, hot, wet, dry, extreme, calm, it’s all controlled by the MagicalMysticalMiracleMolecule. They haven’t moved the goalposts, they’ve installed them along the entire field perimeter." Pay attention Warmers, I'm not the only one who notices these things. Andrew asauber
The question in light of the study posted above @66 on 20% decline. Did Mauna Loa show similar decline during that period? DATCG
On CO2 increase in atmosphere. Here's a study showing a decline by 20% thru 2014...
To be clear, human activity continues to emit increasing amounts of carbon, and the atmospheric concentration of CO2, now at 400 parts per million (ppm), continues to rise. But the scientists found that between 2002 and 2014, the rate at which CO2 increased in the atmosphere held steady at about 1.9 ppm/year. In addition, the proportion of the CO2 emitted annually by human activity that remains in the atmosphere declined by about 20 percent. This slowdown can't keep pace with emissions, so the overall amount of human-caused CO2 in the atmosphere increased, just not as quickly. And for that, new research suggests, we can thank plants.
Link... 20% decline thanks to Plants and Global Warming Pause I'm not sure how accurate the statement is on Plants causing a 20% decline. But it's interesting to see that there was a decline. And how plants can benefit. More on plant activity...
The scientists attribute the stalled CO2 growth rate to an uptick in land-based photosynthetic activity, fueled by rising CO2 levels from fossil fuel emissions. It's a snowball effect: as CO2 levels rise in the atmosphere, photosynthetic activity flourishes and plants take in more carbon, sparking more plant growth, more photosynthesis, and more carbon uptake. They also identified another player. Plant respiration, a process in which plants use oxygen and produce CO2, did not increase as quickly as photosynthesis in recent years. This is because plant respiration is sensitive to temperature, and it was affected by the recent slowdown in global warming that was observed most significantly over vegetated land. So, between 2002 and 2014, plants took in more CO2 through photosynthesis, but did not "exhale" more CO2 into the atmosphere through respiration.
DATCG
I just read rest of Muller's angry comments. I'd missed them. He did not address links on Ocean Acidification or on Great Barrier Reef recovery. But doubled down on angry insults. And claimed they were diversions. The links I posted were not "diversions" but relevant to Ocean Acidification opinions made by him and others. If he disagreed with specifics about Great Barrier Reef Recovery or Ocean Acidification link I provided, he easily could have responded to them. DATCG
Bob, Thanks for caring. Where did you think I "slandered" someone that I might be banned? ;-) Or did you miss Muller's Gish reference towards me? On the spliceosome, I see you don't wish to comment. But it is a scientific post on the Spliceosome and well discussed. Your contention is there's not enough science post here? Yet you or Seversky and other detractors and opponents of ID who regularly comment here, often do not comment on many science post. Maybe it's not that there's not enough? Maybe you're just not interested in areas of science posted here? What areas of science do you like to participate in and comment on? Besides Climate? Because there are many post here on different areas of evolution, cosmology, etc. Dr. Hunter has posted several recent entries on Evolution's current issues. Did you see them? DATCG
“I’d be very interested at looking at this kind of information. Do you have any links?” This provides a general overview. In short, the different sources of CO2 (terrestrial, oceanic and fossil fuels) have different ratios. For example, fossil fuels have no C14, terrestrial sources have less C13 than ocean sources. By analyzing the ratios in the atmosphere you can estimate the proportion from each source. And the changes over time. I don’t know if this type of comparison has been made on ice cores, but I would be surprised if it hasn’t. https://www.esrl.noaa.gov/gmd/outreach/isotopes/mixing.html Molson Bleu
Molson Bleu:
Not on a molecule by molecule basis. But carbon isotope ratios can tell them how much of the CO2 is from fossil fuels and how much from terrestrial sources and how much from the oceans.
I'd be very interested at looking at this kind of information. Do you have any links? PaV
All of that added CO2 and we are now only about 1.7 degrees F warmer than 1880. Heck it changes more than that day to day. ET
That's pretty cool, Bob O'H, thanks. Here's a screenshot for anyone who just wants to see the plots. Edit: I hope I didn't make any copy/paste errors. The plots look like I expected, anyway. daveS
PaV @ 48 -
If you look at the above-mentioned graph, the rate of CO2 growth is rather linear, and steep.
mullers_ratchet @ 49 -
“linear”, you think that graph is linear? That’s funny because in 34 you asked me to explain the “exponential” rise in CO2. The rise is of course exponential, just as we’d expect if the atmospheric rise in CO2 was a consequence of industry.
Actually, it's quicker than exponential - I downloaded the Mauna Loa data and regressed the log of the concentration against time. The residuals still show clear curvature, and then regressing against time and time^2 give a positive quadratic coefficient. If anyone is familiar with R and ants to play, this is my code: # Read in data fileMM <- "ftp://aftp.cmdl.noaa.gov/products/trends/co2/co2_mm_mlo.txt" Data <- read.table(fileMM, header = FALSE, skip=0, na.strings = "-99.99") names(Data) <- c("Year", "Month", "Date", "Average", "Interpolated", "Trend", "days") # Fit models: linear, # log scale (=exponential model), # log with quadratic time mod.lin <- lm(Average ~ Date, data=Data ) mod.log1 <- lm(log(Average) ~ Date, data=Data) mod.log2 <- lm(log(Average) ~ Date + I(Date^2), data=Data) # Plot data and models par(mfrow=c(2,1), mar=c(2,4,2,1), oma=c(2,0,0,0), las=1) plot(Data$Date, Data$Average, type="l", xlab="", ylab=expression(paste(CO[2], " concentration")), main="linear scale") abline(mod.lin, col=2) plot(Data$Date, log(Data$Average), type="l", xlab="", , ylab=expression(paste("log ", CO[2], " concentration")), main="log scale") abline(mod.log1, col=2) lines(Data$Date[!is.na(Data$Average)], mod.log2$fitted.values, col=4) mtext("Year", 1, outer=TRUE) legend(1961, 5.99, c("Exponential", "Supra-exponential"), col=c(1,4), lty=1) (edits to removed tyops etc) Bob O'H
DATGC - good to see you are still here, and able to defend yourself. I don't want to get into spliceosomes, because that's not my area of expertise. Bob O'H
Careful with that Sandwich Eugene... Understanding the impact on Climate Change of convenience food: Carbon footprint of sandwiches Stop eating sandwiches at restaurants & fast food joints? Should everyone stop buying coffee at Starbucks now? ;-) DATCG
lol@ "sliceosome" in #54, correction slice, slice Spliceosome. Either way Bob @ 44, hope you read Gpuccio's OP and join discussion. DATCG
ET @45, yes IPCC has put it out before, but the hockey stick does begin to magically appear. They had to address climate models missing badly on their predictions and the steep upward pace of temps known as the Hockey Stick appeared by Michael Mann. Other scientist challenged. And remember, adjustments were made to lower past temps. Here is what the IPCC shows ... https://www.ipcc.ch/publications_and_data/ar4/wg1/en/ch6s6-6.html
The ‘hockey stick’ reconstruction of Mann et al. (1999) has been the subject of several critical studies. Soon and Baliunas (2003) challenged the conclusion that the 20th century was the warmest at a hemispheric average scale. They surveyed regionally diverse proxy climate data, noting evidence for relatively warm (or cold), or alternatively dry (or wet) conditions occurring at any time within pre-defined periods assumed to bracket the so-called ‘Medieval Warm Period’ (and ‘Little Ice Age’). Their qualitative approach precluded any quantitative summary of the evidence at precise times, limiting the value of their review as a basis for comparison of the relative magnitude of mean hemispheric 20th-century warmth (Mann and Jones, 2003; Osborn and Briffa, 2006). Box 6.4 provides more information on the ‘Medieval Warm Period’.
Remember, the alarmist were predicting end of world Global Cooling in the 70s, prior to end of the world global warming. I think Climate Models still are not good enough to predict 100 years into the future. They failed to predict the Great Pause and the Models trends were way off, running hot as a result. DATCG
Bob, #44 No, still here :) Glad you mentioned me in fact. I see you complained about Science not being posted and discussed here enough on another post. But I see Gpuccio showed you a post on the Sliceosome you could join in. I've not yet seen you comment or take part in the discussion. Why not? It has been a good discussion. Scientist Arthur Hunt with expertise in RNA commented on the subject and offered up some points in opposition against Design and Irreducible Complexity. Challenging Gpuccio's OP and raising information about Group II introns and evolution of the Spliceosome. Please join in. Read Gpuccio's OP and post some comments... https://uncommondescent.com/intelligent-design/the-spliceosome-a-molecular-machine-that-defies-any-non-design-explanation/ DATCG
MR, You clicked on link but could not read it? It was used by Dr. Tim Ball. Dr. Ball states in one of his articles... "My prime area of research was climatology, particularly how climate changes over time and the impact of those changes on human history and the human condition." Here is his CV same site link... http://drtimball.com/_files/dr-tim-ball-CV.pdf Should I insult you now? Are you not familiar with these time frames in Climate history? Little Ice Age? Here's Wiki for you... https://en.wikipedia.org/wiki/Little_Ice_Age Midieval Optimum? Before reconstruction of data was warmest period. Wiki again has it, "A 2009 study by Michael E. Mann et al., examining spatial patterns of surface temperatures shown in multi-proxy reconstructions finds that the Medieval Warm Period(Medieval Optimum), shows "warmth that matches or exceeds that of the past decade in some regions, but which falls well below recent levels globally."[4] Michael Mann gave us the infamous hockey stick, along with Hide the Decline. Does not surprise me he finds latest climate to be hotter than the past. The Climate Models have continuously been wrong. They had to massage the data in the past, make it colder so that warming would look greater the last several decades. DATCG
“When they look under their microscopes, or analyze the atmosphere with their chromatographs, do some CO2 molecules say “man-made” while others say “terrestial”?” Not on a molecule by molecule basis. But carbon isotope ratios can tell them how much of the CO2 is from fossil fuels and how much from terrestrial sources and how much from the oceans. Molson Bleu
mullers_ratchet: I started out saying this was a "possible" teaching moment. How unfortunate it was that a "curve" that was said to arise from measurements at both Hawaii and Antartica turned out to be mostly from Hawaii due to the government cutting back funding for the South Pole portion of the metering. The example of a sink with inflow and outflow was an example of an equilibrium, and came up because I stated this:
Ask yourself this question: What would happen if all man-made CO2 ceased being made? Wouldn’t you expect atmospheric CO2 levels to fall by 4%? Then, contrariwise, the CO2 levels should only be 4% above the 315 ppm level. So, why are they 405 ppm?
. To assume that a small additional inflow would cause the sink to overflow only follows from the presumption that the outflow cannot become any greater. "On average," a small 4% increase in an equilibrium flow situation would likely not greatly aggrevate the system. You seem not to accept this at all. I can't help you there. I think your presumption is that ALL of human made CO2 is independent of the earth's Carbon Cycle, and, so, causes CO2 levels to continually rise. However, in the paper you link to, they state that "only about 40% of those emissions [anthropogenic CO2] have stayed in the atmosphere." This means that 60% is being absorbed by the earth, and is part of the Carbon Cycle. So, is 60% absorbed? Or 80%? Or 100%? We don't know. In fact, the purpose of that paper is to try and find out why this "only 40% of those emissions" has remained constant over five decades:
Of the current 10 billion tons of carbon (GtC) emitted annually as CO2 into the atmosphere by human activities [Boden et al., 2009; Houghton, 2008], only around 40%[Jones and Cox, 2005] remain in the atmosphere, while the rest is absorbed by the oceans and the land biota to about equal proportions [Bopp et al., 2002]. This airborne fraction of anthropogenic CO2 (AF) is known to have stayed remarkably constant over the past five decades [Jones and Cox, 2005], . . .
Think about this: the fraction of anthropogenic CO2 absorbed via the Carbon Cycle [AF] has remained constant for 50 years! Through all kinds of changes. Do you remember writing this:
The. Oceans. Are. Gaining. CO2.
This is what we are being told. How would they know? When they look under their microscopes, or analyze the atmosphere with their chromatographs, do some CO2 molecules say "man-made" while others say "terrestial"? Maybe the number is simply made up. And maybe that's why it remains constant. Have you considered that? Then there's this: (From the beginning of their paper)
The analysis further shows that the statistical model of a constant airborne fraction agrees best with the available data if emissions from land use change are scaled down to 82% or less of their original estimates. Despite the predictions of coupled climate-carbon cycle models, no trend in the airborne fraction can be found.
We're dealing with "man-made" climate models. The old expression was: "Junk in; junk out." Why all this confidence in educated guesses? Better to look around and see what's there. What do we see? We see CO2 levels continue to rise, while global temperatures seem to have leveled off. We see levels of cold and snow not seen in 35 years. If climate models are correct, then how can this happen when CO2 keeps going up? In our part of the galaxy, there are two huge sources of heat: the sun (fusion), and the earth's core (fission). If you want to explain an increase in heat, that's where I would recommend looking first. There's a recent paper out that finds that the rate of glacier melt in Eastern Greenland is correlated to water temperatures. And, guess what, when they started looking aroun they found 11 vents underneath the melting glaciers, with one of the vents measuring about 7 miles across. Same thing recently happened in Antartica. You're entitled to your opinion; but, my bet is when scientists get around to doing real science, the answer to both rising CO2 levels and rising heat can be pinned principally to the earth's core. [Regretably, you can't respond. I hope I've clarified some things.] PaV
Carbon isotope ratios in the atmosphere also point to the increase largely coming from fossil fuels. Molson Bleu
Honestly, why are you like this? You may have the worst ratio of confidence to knowledge I've ever run into.
If you look at the above-mentioned graph, the rate of CO2 growth is rather linear, and steep.
"linear", you think that graph is linear? That's funny because in 34 you asked me to explain the "exponential" rise in CO2. THe rise is of course exponential, just as we'd expect if the atmospheric rise in CO2 was a consequence of industry.
IOW, if the “cause” of excess CO2, and hence CO2 growth in concentration, is industry, then the ‘graph’ should track with the industrial production of CO2 over time. But, of course, it doesn’t
But, in fact, it does. Check out Figure 1 here. The correlation coefficient for human cumulative CO2 emissions v atmospheric CO2 is 0.997! So, let's review the thread. You start with the disparaging title and your own mistake in reading the keeling curve. It soon became apparent that seasonal oscillations were well-understood and your cocky tone and "teaching moment" added up to exactly nothing. You then made a strange mathematical error in claiming a 4% increase in the rate of inflow in a tub (or atmosphere) will lead to a 4% increase in volume. Rather than admitting your error you've just stopped talking about this idea. Next, you came up with some half-remembered bollocks about ocean acidification being a made up excuse of a lack of recent warming despite ever-rising CO2. This betrays your ignorance of ocean acidification, recent temperature records or elementary physics. When you finally produced a 15-year-old press release to substantiate you claim it was talking about how the rise in CO2 was slower than it would be if there was no ocean sink. You then jumped on the Antarctic ice core data, making a great deal of the fact the recent increase in CO2 starts in the 1850s or so. You first described the rate of increase as "exponential", but when you had to weasel your way out of mistake you claimed it was linear. Why you got yourself into that mess I don't know. Perhaps you were unaware of the industrial revolution or that burning coal produces CO2? Whatever the source of your ignorance, it's perfectly obvious that the rapid onset of CO2 accumulation exactly at the time that humans started emitting a lot of CO2 is evidence for the fact humans emitted the extra CO2 that is accumulating in the atmosphere. Most amazingly of all: even after making all of these impressive displays of ignorance you still think you are right and that your cockamamie theory about recent CO2 increases coming from the ocean is viable despite the clear evidence that the oceans are gaining and not losing CO2. What kind of person puts up a track record like the one above and doesnt' even stop to think they might be clueless about this topic? UD Editors: Mullers_ratchet is no longer with us. mullers_ratchet
mullers_ratchet:
You may have heard of the industrial revolution…
If this is supposed to be your reply to my question posed to you, then it is an ill-considered reply. If you look at the above-mentioned graph, the rate of CO2 growth is rather linear, and steep. Now, if the CO2 produced by industry is the cause of the rise in CO2, then the slope of the graph should directly reflect the amount of CO2 produced by industry. So, then, in terms of today's industrial production of CO2, what was the percentage of CO2 production in the 1850's? Maybe one-twentieth of today, or one-fifth of one percent. And what would it have been in early 1900? Or in 1940 or 1970? IOW, if the "cause" of excess CO2, and hence CO2 growth in concentration, is industry, then the 'graph' should track with the industrial production of CO2 over time. But, of course, it doesn't. So, as I say, you gave an ill-considered response. Try again. PaV
A possible alternative, albeit lacking pithiness:
red herrings, designed to side-track attention, leading us away to a convenient strawman soaked in ad hominems and ignited to cloud, confuse, polarise and poison the atmosphere.
This has similar meaning, but acknowledges some sensitivity to the late Dr Gish. daveS
Note to muller- It's only a "gish gallop" if you don't have time to answer/ respond to all of it. And here that does not apply so clearly you are mistaken. ET
muller @ 40:
Do you know what data was used to reconstruct that temperature? Or where the graph comes from?
IPCC 1990 has a similar graph- it appears climate proxies were used along with actual temperature data ET
kf -
you have obviously failed to read the linked corrective, and seem to imagine that gratuitously slandering someone now unable to defend himself
That's a shame. Has DATCG been banned? Bob O'H
MR, you have obviously failed to read the linked corrective, and seem to imagine that gratuitously slandering someone now unable to defend himself, is a responsible pattern of behaviour. Duly noted. Ilk duly recognised. KF kairosfocus
what a cast of characters this place has! "Formally"? you're "formally" telling me you don't like a turn of phrase? Let me hereby formally inform you that I consider the phrase "gish gallop" accurately describes DATCG's diversionary tactics. For this reason, I must further inform you that I will continue to use this phrase as and when I consider it to fairly and reasonably describe the actions of a commenter on this website. mullers_ratchet
MR, I formally draw your attention to a corrective regarding a term of abuse and slander you have resorted to yet again: https://uncommondescent.com/darwinism/notice-on-the-gish-gallop-false-accusation-tactic-and-fallacious-dodge/ I suggest that in future you refrain yourself from such a trollish reference. KF kairosfocus
I would usually indulge a gish-galloper, but this made me laugh...
Graph of Climate Change… Last Thousand Years European Climatic Changes
Do you know what data was used to reconstruct that temperature? Or where the graph comes from? mullers_ratchet
A different opinion on ocean acidification by Jim Steele... How NOAA and Bad Modeling Invented an “Ocean Acidification” Icon: Part 1 - Sea Butterflies
Bednarsek assumes anthropogenic carbon is mostly accumulating near the surface based on modeling results. However as detailed in Part 2*, all ocean acidification models are deeply flawed based on an incorrect assumption that CO2 enters the ocean and is then transported like an inert tracer. But CO2 is not inert! When CO2 first invades sunlit surface waters, it indeed dissolves into 3 forms of inorganic carbon (DIC) and lowers pH (DIC is discussed in How Gaia and Coral Reefs Regulate Ocean pH). But in contrast to those models, DIC is rapidly assimilated into particulate organic carbon via photosynthesis, which raises pH. Particulate organic carbon (alive or dead) is heavy, and if not consumed and recycled, it sinks. For millions of years, this process created and maintained a DIC/pH gradient with high pH/low DIC near the surface and low pH/higher DIC at depth. Gravity drives the biological pump and removes a significant proportion of organic carbon (assimilated from both natural and anthropogenic carbon). That carbon is transported to depths where it can be harmlessly sequestered for hundreds to thousands of years. However NOAA’s models fail to account for the biological pump, based on the narrow belief that carbon storage is strictly “a chemical and physical response to rising atmospheric CO2” (Sabine 2010). In contrast to Bednarsek’s anthropogenic hypothesis, an increase in the assimilation of CO2 and an efficient biological pump can prevent a decrease in surface pH and calcium carbonate saturation. In fact experiments show CO2 is often a limiting nutrient. Mesocosm experiments found that when atmospheric CO2 was increased, primary production by plankton community consumed 39% more DIC. When primary production increases, more carbon is shuttled to depth.
*Part 2... Are the Oceans’ Upper Layers Really Acidifying?
However, unlike inert CFCs, any CO2 entering sunlit waters is quickly converted to heavy organic matter by photosynthesis. Although dissolved CFCs and dissolved carbon are passively transported in the same manner, particulate organic carbon (alive or dead) behaves very differently. Particulate carbon rapidly sinks, removing carbon from the surface to depth in ways CFC tracers fail to simulate. Examination of the literature suggests “various methods and measurements have produced estimates of sinking velocities for organic particles that span a huge range of 5 to 2700 meters per day, but that commonly lie between tens to a few hundred meters per day”. Low estimates are biased by suspended particles that are averaged with sinking particles. Faster sinking rates are observed for pteropod shells, foraminifera, diatoms, coccolithophorids, zooplankton carapaces and feces aggregations, etc that are all capable of sinking 500 to 1000 meters per day. These sinking rates are much too rapid to allow respired CO2 from their decomposition to acidify either the source waters of upwelling such as along the Oregon and California coast, or the surface waters
. DATCG
Graph of Climate Change... Last Thousand Years European Climatic Changes What human influence led to the Medieval Optimum? What caused Little Ice Age? How does Modern Era compare to both Medieval Optimum and Little Ice Age? What is worse. To little CO2? Or more CO2? What amount of CO2 is good for plants and vegetation? DATCG
dated Oct 2017... Great Barrier Reef Returning to Life
"'The majority of coral colonies on the inshore reefs have regained their color and the growth of some colonies was so good they had overgrown our original research tags,' Dr Bay said."
DATCG
“Did you look at the graph? Please explain the exponential rise of CO2 levels in the Antartica ice cores starting in the 1800’s.“ I think that Mullers_ratchet explained this. This is further supported by the dramatic increase in lead deposition in Anartica in the 1800s as recorded in the ice cores. Atmospheric circulation and the climate of the Antarctic, make it very good at recording historic conditions. Molson Bleu
You may have heard of the industrial revolution... mullers_ratchet
muller's ratchet: Did you look at the graph? Please explain the exponential rise of CO2 levels in the Antartica ice cores starting in the 1800's. Was the ocean "gaining" CO2 then? And, if it was, then WHERE did all the extra CO2 come from? If you can't answer that question, then realize you stopped thinking a long time ago. PaV
Really, what is wrong with you?
Or, maybe, the earth’s core has warmed up, with the concomitant heating up of the oceans, which then release CO2. Much more plausible.
The. Oceans. Are. Gaining. CO2. mullers_ratchet
mullers_ratchet:
Acidification is not made up, it’s very clear that the ocean is absorbing CO2 and pH is lowerig as a result. It can’t be an “excuse” for the failure of temperature to rise because (i) it doesn’t provide an explanation as to why temps wouldn’t rise and (ii) temperatures are rising.
Maybe my recollection of all this is wrong, but what I remember is some statement made within the last year, or two, saying that the reason for the global warming hiatus is that the ocean's have been absorbing CO2. Again, maybe I'm wrong, but that's what I remember. Just found this. I quote:
The researchers say the oceans' removal of the carbon dioxide from Earth's atmosphere has slowed global warming.
As to increased CO2 production, see this graph taken from Antartica ice cores. CO2 production begins to skyrocket in the early-t0-mid 1800's. So, I guess humans have been putting 4% extra CO2 into the atmosphere for over 150 years. Or, maybe, the earth's core has warmed up, with the concomitant heating up of the oceans, which then release CO2. Much more plausible. PaV
Why are you like this? What would happen if you just admitted you didn't know very much abotu this topic, and perhaps you had it all wrong? This last comment is just strange.
The “acidification” scheme reminds us here at UD of evolutionary explanations: all of them are ex post facto. Another name for them is this: excuses. Global warmists, intent on explaining why temperatures are not rising even as CO2 levels are rising–that is, the Keeling Curve, have come up with this notion. It is no more than ‘hand-waving,’ a la most ‘evolutionary’ explanations of the facts.
Where did you get this from? Acidification is not made up, it's very clear that the ocean is absorbing CO2 and pH is lowerig as a result. It can't be an "excuse" for the failure of temperature to rise because (i) it doesn't provide an explanation as to why temps wouldn't rise and (ii) temperatures are rising. So what the hell are you on about?
As to the 4%, again, if humans stopped producing fossil fuel emissions, would the total CO2 in the atmosphere “go down” 4% each year until it became 0% And since CO2 levels won’t keep going ‘down’ if fossil fuels are no longer burned, then what makes you think that CO2 levels will keep going ‘up’?
Remember, you first made the ignorant claim that adding 4% to the flux would only lead to a 4% increase in the total amount of CO2 in the atmosphere. Can you at least admit you had that wrong? If we take fossil CO2 that has been out of the carbon cycle for millions of years and pump it into the atmosphere it will stay there (and be absorbed by the ocean). We know we are responsible for all of the extra CO2 in the atmosphere because our emissions are considerbly greater than the amount added. It's really as simple as that.
This makes no sense. So, we look for another answer (and, it’s easy): CO2 condensates found in the ocean are slowly finding their way into the atmosphere because the oceans are warming up, ever so slightly.
If the recent increase in CO2 is coming from the oceans, where does all the CO2 produced from burning fossil fuels go? Rememember, the year-on-year increase is in the atmosphere is less than the amount we release (because a lot of it goes into the ocean). If the extra atmospheric CO2 is coming from an unknown source in the ocean, where is all out CO2 hiding? mullers_ratchet
Warmers simply do not care if they waste- someone else's time, someone else's money, science's credibility, and my patience. They made a squiggly line that goes up on the right end, and by a God they don't have any evidence for, you're gonna become a believer in it, and if you don't, they'll hate you for it. Andrew asauber
First off, c02 is not a well mixed gas as NASA's own data reveals, and it is heavier than air - see article. This is extremely important as you have yet another key assumption (Like the falsified assumption Al Gore used as a "smoking gun", that atmospheric c02 drives up temps, instead we found temps drive out more c02). So what you get from a sensor on a volcano is background c02 at a particular altitude, and particular latitude - they also apply a 70 year smoothing average to this data (just like they did when picking the absolute lowest ICE core c02 proxy data- then moved it over 35 years to have it magically line up perfectly with the Keeling curve), and the calibration rights to this and other "official" sensors around the globe are in the hands of former IPCC members. The well mixed gas concept was assumed from the get go - in fact the IPCC through out 9K regional chemical analysis of c02 during the 20th century, other very important stomatal proxy evidence. So from the very lowest values they could pick, they then smoothed it with a 70 year average to take out the inconvenient normal variations with time which can be large - in fact it was well accepted before this nonsense, that c02 was at least 425ppm in the early 1940's and almost as high two other times in the 20th century - so from the ground up, the make the data fit the theory, and they ignore graph that clearly showed a temp rise from the late 1920's to the early 40's, AND hide the 2.4F cooling from the late 40's through the 70's - these are their own graphs, and even their own words contradict what they say now. The entire "thoery" is built out of fraud from the start. As Willie Soon tries to point out to us, almost everything that lives produces c02, and many abiotic systems as well. Example - plain old soil puts out 9X the amount of c02 than ALL of man's activities, termites 2X the c02 than man's use of FF. This is not science, it is a purposefully non-falsifiable thoery - if it were evaluated as other non-political hypotheses, it would be thrown out in a heartbeat. If you have to heavily alter existing and current data, use less and less ground temp stations, and use mainly those that suffer from UHI effects, get rid of the medieval warm period and get caught in emails that you had to do it to make your point, when allow a warmunist activist admin privileges on wiki, and he hides well over 100 papers about the ice age scare of the 70's, and still call yourself scientists then you should feel very ashamed over this agenda driven bull. http://drtimball.com/2013/why-and-how-the-ipcc-demonized-co2-with-manufactured-information/ https://co2insanity.com/2011/09/04/top-scientists-in-heated-debate-over-%E2%80%98-slaying-of-greenhouse-gas-theory/ Tom Robbins
PS to my #27: I can envision a scenario where, for example, turning a faucet down by 50% would allow the tub/sink to drain completely (i.e., the level would decrease by 100%). daveS
PaV, Well, I'm simply essentially saying that without more details, we cannot say whether the CO2 concentration would fall by only 4% if humans stopped producing CO2 emissions. Isn't that correct? I don't know what the new equilibrium would be, but it's not at all clear that it would be ~390 ppm (4% less than the current level) based only on the sink analogy. daveS
daveS: I need more details. PaV
"The “acidification” scheme reminds us here at UD of evolutionary explanations: all of them are ex post facto. Another name for them is this: excuses." I don't claim to be an expert on global warming and climate change, but I do know a bit about the oceans. CO2 is seldom a limiting nutrient in the ocean, it is usually nitrogen and/or phosphorus. The oceans act as a sink for CO2, through algal growth and subsequent death, and through incorporation in shells and corals. However, if the amount of CO2 entering the ocean exceeds the amount incorporated into organisms and shells, then the ocean becomes more acidic, which it is. Whether this is due to global warming, I don't know. I leave those conclusions to the experts in the field. Molson Bleu
PaV,
Ask yourself this question: What would happen if all man-made CO2 ceased being made? Wouldn’t you expect atmospheric CO2 levels to fall by 4%? Then, contrariwise, the CO2 levels should only be 4% above the 315 ppm level. So, why are they 405 ppm?
Based on further analysis of the sink analogy, do you agree that it's not necessarily the case that CO2 levels would fall by only 4% if humans stopped producing CO2 emissions? daveS
For Warmists, every question about a very complex weather system resolves into protecting the AGW story. LOL Its funny to watch. Andrew asauber
mullers_ratchet:
4% is the human controbution to the flux of CO2 (the in-flow). What I’m trying to tell you is that the amount of CO2 we’ve added in the last few decades is considerably greater than the amount that has accrued in the atmosphere. Very hard to blame natural causes given this fact. (The rest of it has gone into the ocean, which is why (whether you belive it or not) the ocean’s disoved CO2 has risen and pH has fallen).
The "acidification" scheme reminds us here at UD of evolutionary explanations: all of them are ex post facto. Another name for them is this: excuses. Global warmists, intent on explaining why temperatures are not rising even as CO2 levels are rising--that is, the Keeling Curve, have come up with this notion. It is no more than 'hand-waving,' a la most 'evolutionary' explanations of the facts. As to the 4%, again, if humans stopped producing fossil fuel emissions, would the total CO2 in the atmosphere "go down" 4% each year until it became 0%? The obvious answer is "no." And since CO2 levels won't keep going 'down' if fossil fuels are no longer burned, then what makes you think that CO2 levels will keep going 'up'? This makes no sense. So, we look for another answer (and, it's easy): CO2 condensates found in the ocean are slowly finding their way into the atmosphere because the oceans are warming up, ever so slightly. PaV
PaV,
If the bathtub is “filling up,” then there is no established ‘equilibrium,’ and you would be foolish to leave the premises. However, if there is an equilibrium, then what becomes critical is the relationship between the added rise in water level (which increases the ‘pressure’ felt by the water issuing forth from the sink) and the flow rate.
Indeed. What I intended was that you fill the tub to some particular level (say 50%) and then adjust the tap until it is at equilibrium. Then increase the flow by 4%. What happens from that point on would depend on the specifics, as mullers_ratchet stated. Without more information, I don't think we can say whether the water level will increase only slightly or whether the tub will overflow. I don't know anything about atmospheric sciences; I'll stick to bathtubs. daveS
You’re acting as if the sink somehow got plugged up. If that were to have happened, then, yes, the sink would overflow. But, instead, you have a steady-state equation, with the increased in-flow increasing the out-flow...
For the sink example, increased height may change that out-flow slightly, but derterming wether a given in-flow will reach a new equilibrium height is not straigtfoward and depends on the shape of the sink (among other things). It's certainly not true that because the rate of inflow icnreases by 4% the volume of the sink should increase by the same amount only! Also, the atmosphere is not a bathtub.
What is this sentence supposed to mean? 4% is 4%.
4% is the human controbution to the flux of CO2 (the in-flow). What I'm trying to tell you is that the amount of CO2 we've added in the last few decades is considerably greater than the amount that has accrued in the atmosphere. Very hard to blame natural causes given this fact. (The rest of it has gone into the ocean, which is why (whether you belive it or not) the ocean's disoved CO2 has risen and pH has fallen). mullers_ratchet
So I'm guessing daveS and m_r know the C02 cycle with certainty due to their tireless study of it between UD blog comments. Andrew asauber
PaV, You have to remember that Warmists (presumably like daveS and mullers_ratchet) are committed to The Narrative, and therefore cannot process even a little adverse information. They can't distinguish that rational thought may exist outside of the Global Warming paradigm. In layman's terms, they are brainwashed. Andrew asauber
BA77: Nice to have you back. I love this:
Over the past 150 million years, carbon dioxide had been drawn down steadily (by plants) from about 3,000 parts per million to about 280 parts per million before the Industrial Revolution. If this trend continued, the carbon dioxide level would have become too low to support life on Earth.
"The sky is falling!! The sky is falling!!" PaV
daveS: If the bathtub is "filling up," then there is no established 'equilibrium,' and you would be foolish to leave the premises. However, if there is an equilibrium, then what becomes critical is the relationship between the added rise in water level (which increases the 'pressure' felt by the water issuing forth from the sink) and the flow rate. Even CO2 silliness presumes that an equilibrium existed prior to man-made emissions. So, nice try, but equilibrium CO2 levels should be, roughly, about 4% higher, and no more. Are we to believe that a system capable of handling 24 times more than man-made emissions is going to be run off the road by the additional 4%? Who can believe such tripe? There was a "little Ice Age" back in the 1700's. How did that end? Man-made emissions? Would you like to proffer some explanation? PaV
PaV,
IOW, let’s say you were filling up a sink with water, depending on the flow rate out of the sink, and the flow rate into the sink, there would be an equilibrium level of water in the sink. Now, if you increase the flow of water into the sink by 4%, you should expect the level to rise about 4%.
Why don't you try this with your bathtub. Turn up the flow 4% and leave for the weekend. Bonus points if you live in a 2nd floor apartment. :P daveS
muller's ratchet:
If the amount of water going into the sink is more than the amount draining from it the water level will rise constantly. It doesn’t stop when it get’s to 4% more.
Did you think about what you just wrote? You're acting as if the sink somehow got plugged up. If that were to have happened, then, yes, the sink would overflow. But, instead, you have a steady-state equation, with the increased in-flow increasing the out-flow, with a new equilibrium being established: i.e., the level in the sink will be relatively higher. (4% is not 50%, which could possibly be tolerated if the sink is deep enough)
Human emissions are considerably greater than the amount of CO2 added to the atmosphere in recent times, largely because the oceans are gaining not losing dissolved CO2 (you may have heard of ocean acidification).
What is this sentence supposed to mean? 4% is 4%. And, BTW, "ocean acidification" is pure propaganda, intended to explain the "global warming," oops!, the "climate change" hiatus. It's bogus nonsense. Sophisticated bloviation,no more. PaV
OMFG... did you even think about ths?
IOW, let’s say you were filling up a sink with water, depending on the flow rate out of the sink, and the flow rate into the sink, there would be an equilibrium level of water in the sink. Now, if you increase the flow of water into the sink by 4%, you should expect the level to rise about 4%
If the amount of water going into the sink is more than the amount draining from it the water level will rise constantly. It doesn't stop when it get's to 4% more. Human emissions are considerably greater than the amount of CO2 added to the atmosphere in recent times, largely because the oceans are gaining not losing dissolved CO2 (you may have heard of ocean acidification). I guess there was a learning moment in here after all. mullers_ratchet
There is NO teachable moment. This is because the Keeling Curve was falsely advertised as representing continuous recordings of CO2 from Mauna Loa and from Antartica. Had this truly been the case, then it would have been interesting to see if the CO2 osciallation was due more to ocean currents rather than vegetation activity during springtime. (See more below)* But, alas, the basic Keeling Curve (above) seems to represent Mauna Loa alone. This, of course, changes everything, and rules out alternative mechanisms--for the time being. ///////////////// *I'm convinced that the CO2 elevations come from the warming of the oceans, probably due to a heating up of the earth's core. Recent evidence and studies seem to support such a theory. Along these lines, let's consider that the Keeling Curve gives us a good view of atmospheric CO2 levels. Over the last 60 years it's gone from 315 ppm to almost 405 ppm. Now, further consider this: the amount of CO2 produced by human fossil-fuel use is roughly 4% of the TOTAL CO2 cycle, i.e., CO2 that is released into the environment, and then absorbed by various objects, notably trees and vegetation. Ask yourself this question: What would happen if all man-made CO2 ceased being made? Wouldn't you expect atmospheric CO2 levels to fall by 4%? Then, contrariwise, the CO2 levels should only be 4% above the 315 ppm level. So, why are they 405 ppm? IOW, let's say you were filling up a sink with water, depending on the flow rate out of the sink, and the flow rate into the sink, there would be an equilibrium level of water in the sink. Now, if you increase the flow of water into the sink by 4%, you should expect the level to rise about 4%. If you restricted the flow by 4%, you'd expect the water level to drop by 4%. So, the question remains? Why has atmospheric CO2 risen by 29% when humans have only added an additional 4% to the "total" atmospheric CO2 that is recycled every year? The most plausible explanation is, again, that the ocean's are heating up ever so slightly, and releasing CO2 condensate. IOW, this is simply a natural cycle. No need for hysteria. PaV
“A few inconvenient facts for our Atheistic chicken little global warming alarmists...” But the question asked was what explained the seasonal fluctuation in the inset plot. Do you have something to say about that? Molson Bleu
In the following articles, Michael Denton and Eric Metaxus gives us a glimpse at just how special Earth’s atmosphere actually is:
The Cold Trap: How It Works – Michael Denton – May 10, 2014 Excerpt: As water vapor ascends in the atmosphere, it cools and condenses out, forming clouds and rain and snow and falling back to the Earth. This process becomes very intense at the so-called tropopause (17-10 km above sea level) where air temperatures reach -80°C and all remaining water in the atmosphere is frozen out. The air in the layer of the atmosphere above the troposphere in the stratosphere (extending up to 50 km above mean sea level) is absolutely dry, containing oxygen, nitrogen, some CO and the other atmospheric gases, but virtually no H2O molecules.,,, ,,,above 80-100 km, atoms and molecules are subject to intense ionizing radiation. If water ascended to this level it would be photo-dissociated into hydrogen and oxygen and, the hydrogen being very light, lost into space. Over a relatively short geological period all the water and oceans would be evaporated and the world uninhabitable.,,, Oxygen, having a boiling point of -183°C, has no such problems ascending through the tropopause cold trap into the stratosphere. As it does, it becomes subject to more and more intense ionizing radiation. However this leads,, to the formation of ozone (O3). This forms a protective layer in the atmosphere above the tropopause, perfectly placed just above the cold trap and preventing any ionizing radiation in the far UV region from reaching the H2O molecules at the tropopause and in the troposphere below. http://www.evolutionnews.org/2014/05/the_cold_trap_h085441.html Existence Itself Is a Miracle – Oct. 2014 Excerpt: “For instance, if the earth were slightly larger, it would of course have slightly more gravity. As a result, methane and ammonia gas, which have molecular weights of sixteen and seventeen respectively, would remain close to the surface of the earth. Since we can’t breathe methane or ammonia because of their toxicity, we would die. If Earth were slightly smaller, water vapor would not stay close to the planet’s surface, but would instead dissipate into the atmosphere. Obviously, without water we couldn’t exist.” Eric Metaxus https://www.breakpoint.org/bpcommentaries/entry/13/26299
In the following articles and video, Michael Denton further reflects on just how extraordinary the chemistry of Earth’s atmosphere is for human life:
The Place of Life and Man in Nature: Defending the Anthropocentric Thesis – Michael J. Denton – February 25, 2013 Summary (page 11) Many of the properties of the key members of Henderson’s vital ensemble —water, oxygen, CO2, HCO3 —are in several instances fit specifically for warm-blooded, air-breathing organisms such as ourselves. These include the thermal properties of water, its low viscosity, the gaseous nature of oxygen and CO2 at ambient temperatures, the inertness of oxygen at ambient temperatures, and the bicarbonate buffer, with its anomalous pKa value and the elegant means of acid-base regulation it provides for air-breathing organisms. Some of their properties are irrelevant to other classes of organisms or even maladaptive. It is very hard to believe there could be a similar suite of fitness for advanced carbon-based life forms. If carbon-based life is all there is, as seems likely, then the design of any active complex terrestrial being would have to closely resemble our own. Indeed the suite of properties of water, oxygen, and CO2 together impose such severe constraints on the design and functioning of the respiratory and cardiovascular systems that their design, even down to the details of capillary and alveolar structure can be inferred from first principles. For complex beings of high metabolic rate, the designs actualized in complex Terran forms are all that can be. There are no alternative physiological designs in the domain of carbon-based life that can achieve the high metabolic activity manifest in man and other higher organisms. http://bio-complexity.org/ojs/index.php/main/article/view/BIO-C.2013.1/BIO-C.2013.1 Privileged Species – video https://www.youtube.com/watch?v=VoI2ms5UHWg A Reasonable, but Incomplete, Account of How Humans Mastered Fire – Michael Denton – August 4, 2016 In short, the discovery of fire, our subsequent mastery of it, and the road it opened up to an advanced technology were only possible because of our inhabiting a world almost exactly like planet earth, complete with atmospheric conditions exactly as they are, along with the properties of carbon and oxygen atoms (and indeed many of the other atoms of the periodic table), and because we possessed a unique anatomical design (including the hand) uniquely fit for fire-making. http://www.evolutionnews.org/2016/08/a_reasonable_bu103048.html
Indeed, the earth and humans in particular are now shown to have far more significance in this universe than atheists had ever presupposed that we would have:
Humanity - Chemical Scum or Made in the Image of God? - video https://www.youtube.com/watch?v=ElBWAwjPzyM
Moreover as was mentioned previously, although other atmospheres on other planets are quite different from Earth’s atmosphere, (in fact all other planets that we know about, with substantial atmospheres, all have opaque atmospheres which do not allow sunlight to penetrate to their surfaces), It is important to note just how fine-tuned our atmosphere for visible light to penetrate it.
Quote: “,,,These specific frequencies of light (that enable plants to manufacture food and astronomers to observe the cosmos) represent less than 1 trillionth of a trillionth (10^-24) of the universe’s entire range of electromagnetic emissions.” - Fine tuning of Light, to Atmosphere, Water, Photosynthesis, and Human Vision (etc.) - video https://www.youtube.com/watch?v=WiN9dU0W6rQ
Thus in conclusion, the atheist’s assumption for a stable climate that is optimal for life is actually a hidden Theistic assumption on his part. On Atheism there simply is no reason to presuppose that the climate should have been ‘surprisingly stable’ for life for all these billions of years, or to presuppose that the climate will remain ‘surprisingly stable’ for any extended period of time hereafter. Only on Theism is the assumption of a stable climate warranted:
Genesis 8:22 While the earth remains, seedtime and harvest, cold and heat, summer and winter, day and night, shall not cease.”
bornagain77
Comparisons to other solar systems that have now been discovered bares out just how special the Earth’s stable solar system actually is:
Paper in Proceedings of the National Academy of Sciences Suggests Our Solar System Is Exceptional – Casey Luskin – September 10, 2015 Excerpt: our solar system stands out dramatically compared to other solar systems we’ve discovered and that getting rocky planets orbiting near their star as Earth does, in the circumstellar habitable zone, requires a very exceptional set of circumstances. http://www.evolutionnews.org/2015/09/paper_in_procee099171.html Earth Resides in an “Oddball” Solar System - January 19, 2018 Excerpt: Our solar system may be an oddball in the universe. A new study using data from NASA’s Kepler Space Telescope shows that in most cases, exoplanets orbiting the same star have similar sizes and regular spacing between their orbits. https://uncommondescent.com/intelligent-design/yer-average-planet-watch-earth-resides-in-an-oddball-solar-system/ How weird is our Solar System? Is it odd like your quirky uncle, or odd like a leprechaun riding a unicorn? – May 2015 Excerpt: “It’s increasingly seeming that the solar system is something of an oddball,” says Gregory Laughlin, a planetary scientist at the University of California, Santa Cruz in the US.,,, Once you get over the fact that planets are as common as stars, you’re faced with their startling diversity. “We kind of always vaguely hoped and expected planets to be common,” Laughlin says. “And that’s absolutely right – they are common. But they are weirder than our own solar system would lead us to expect.”,,, “Having nothing interior to Mercury’s orbit and having Jupiter itself – a massive planet on a Jupiter-like orbit – combine to make us unusual,” Laughlin says.,,, “Every indication right now looks like we might be rare,” Walsh says.,,, “There’s zero evidence that Earth-like environments are common,” Laughlin says. “There’s zero evidence that life is common.” http://www.bbc.com/earth/story/20150515-how-weird-is-our-solar-system Planet-Making Theories Don’t Fit Extrasolar Planets; Excerpt: “The more new planets we find, the less we seem to know about how planetary systems are born, according to a leading planet hunter.” We cannot apply theories that fit our solar system to other systems: http://www.creationsafaris.com/crev201102.htm#20110223b
In particular, the atmospheres, and chemical compositions, of exoplanets are turning out to be far more diverse than was expected:
Compositions of Extrasolar Planets – July 2010 Excerpt: ,,,the presumption that extrasolar terrestrial planets will consistently manifest Earth-like chemical compositions is incorrect. Instead, the simulations revealed “a wide variety of resulting planetary compositions. http://www.reasons.org/compositions-extrasolar-planets Hubble reveals diversity of exoplanet atmosphere: Largest ever comparative study – December 14, 2015 Excerpt: “We found the planetary atmospheres to be much more diverse than we expected.” http://phys.org/news/2015-12-hubble-reveals-diversity-exoplanet-atmosphere.html Rains On Different Worlds – info graphic (sulfuric acid rain, glass rain, diamond rain, iron rain, methane rain) http://tehgeektive.com/wp-content/uploads/2015/01/rain-on-different-planets.jpg Molten glass files: Blue alien planet is NOT like Earth – Nov. 3, 2016 Excerpt: And then there’s the weather. The winds on HD 189733b (which lies about 63 light-years from Earth, in the constellation Vulpecula) blow at up to 5,400 mph (8,700 km/h) — about seven times the speed of sound. And if that’s not crazy enough for you, scientists think the rain on this world is made not of water, but of molten glass. https://uncommondescent.com/intelligent-design/molten-glass-files-blue-alien-planet-is-not-like-earth/
bornagain77
And to top all that off, Atheists have no explanation for why the climate on Earth has remained ‘surprising stable’ for billions of years in the first place
A Stable Atmosphere: Another Reason Our Planet Is Special – Daniel Bakken – January 20, 2015 Excerpt: David Waltham’s central argument in Lucky Planet is that the geological evidence shows the Earth has had a “surprisingly stable climate.”1 There are many reasons the Earth shouldn’t have one. He observes, “[O]ur beautiful, complex biosphere could never have occurred if Earth had not enjoyed billions of years of reasonably good weather.”2 There are many processes that keep Earth’s environment habitable, “which [in] the Earth’s case may be special rather than universal.”3 http://www.evolutionnews.org/2015/01/a_stable_atmosp092851.html
 the following articles highlight just how ‘special’ Earth’s case turns out to be:
We may be overlooking a critical factor in our quest to find alien life – August 2016 Excerpt: Many scientists assume that plate tectonics is a given on rocky, Earth-like worlds, but this may be rarer than anyone imagined. A new study in the journal Science Advances questions the idea that rocky worlds “self regulate” their heat after forming. The implications could be enormous, says study author Jun Korenaga, a geophysicist at Yale University. Essentially, we could be overlooking another “Goldilocks” factor in our searches for worlds habitable to aliens: a planet’s initial temperature. If you’re a planet and you start out too hot, the thick layer of rock below the crust called the mantle doesn’t give you plate tectonics. If you’re too cold, you also don’t get plate tectonics. The mantle is not as forgiving as scientists once assumed: you have to have the right internal temperature to begin with. “Though it’s difficult to be specific about how much, it surely does reduce the number of habitable worlds,” Korenaga wrote in an email to Business Insider. “Most … Earth-like planets (in terms of size) probably wouldn’t evolve like Earth and wouldn’t have an Earth-like atmosphere.” That would mean that many planets in the “Goldilocks” zone may not be habitable after all.,,, ,,, Mars and Venus weren’t so lucky. Those planets have a “stagnant lid” of relatively unbroken crust, and in Venus’ case, the consequences are clear: Without the ability to bury carbon in the atmosphere, the surface turned into an 860-degree-Fahrenheit hell. The new models suggest that rocky planets which can regulate their temperature, and thus develop all the geologic support systems life needs to emerge and thrive, are much rarer than we might hope.,,, he wrote. “[A] planet like Earth could well be the one of a kind in the universe.” http://www.businessinsider.com/goldilocks-exoplanet-habitability-internal-heat-2016-8 Scientists ‘Iron Out’ Phenomenon That Sustains Magnetic Field Of Earth – 2 June 2016 Excerpt: “Without Earth’s magnetic field, life on the planet might not exist. For 3.4 billion years, this magnetic field has prevented Earth from becoming extremely vulnerable to high-energy particles called cosmic radiation. Scientists know that what generates the protective magnetic field is the low heat conduction of liquid iron in the planet’s outer core. This phenomenon is known as “geodynamo.” However, although geodynamo has been identified, experts have yet to understand how it was first created and sustained all throughout history….In the end, researchers found that the ability of iron to transmit heat were not at par with previous estimates of thermal conductivity in the core. It was actually between 18 and 44 watts per meter per kelvin. This suggests that the energy needed to sustain the geodynamo has been present since very early in Earth’s history, researchers concluded. http://www.techtimes.com/articles/162458/20160602/scientists-iron-out-phenomenon-that-sustains-magnetic-field-of-earth.htm
Moreover, besides having the just right conditions to enable long term plate tectonics, and a magnetic field, which is a necessary condition for advanced human life, solar systems which are able to maintain a proper ‘goldilocks’ orbit for billions of years for any planet like earth are much rarer than was previously thought:
“You might also think that these disparate bodies are scattered across the solar system without rhyme or reason. But move any piece of the solar system today, or try to add anything more, and the whole construction would be thrown fatally out of kilter. So how exactly did this delicate architecture come to be?” R. Webb – Unknown solar system 1: How was the solar system built? – New Scientist – 2009 Milankovitch Cycle Design – Hugh Ross – August 2011 Excerpt: In all three cases, Waltham proved that the actual Earth/Moon/solar system manifests unusually low Milankovitch levels and frequencies compared to similar alternative systems. ,,, Waltham concluded, “It therefore appears that there has been anthropic selection for slow Milankovitch cycles.” That is, it appears Earth was purposely designed with slow, low-level Milankovitch cycles so as to allow humans to exist and thrive. http://www.reasons.org/milankovitch-cycle-design Evidence from self-consistent solar system n-body simulations is presented to argue that the Earth- Moon system (EM) plays an important dynamical role in the inner solar system, stabilizing the orbits of Venus and Mercury by suppressing a strong secular resonance of period 8.1 Myr near Venus’s heliocentric distance. The EM thus appears to play a kind of “gravitational keystone” role in the terrestrial precinct, for without it, the orbits of Venus and Mercury become immediately destabilized. … First, we find that EM is performing an essential dynamical role by suppressing or “damping out” a secular resonance driven by the giant planets near the Venusian heliocentric distance. The source of the resonance is a libration of the Jovian longitude of perihelion with the Venusian perihelion longitude. http://iopscience.iop.org/1538-3881/116/4/2055/pdf/1538-3881_116_4_2055.pdf Of Gaps, Fine-Tuning and Newton’s Solar System – Cornelius Hunter – July 2011 Excerpt: The new results indicate that the solar system could become unstable if diminutive Mercury, the inner most planet, enters into a dance with Jupiter, the fifth planet from the Sun and the largest of all. The resulting upheaval could leave several planets in rubble, including our own. Using Newton’s model of gravity, the chances of such a catastrophe were estimated to be greater than 50/50 over the next 5 billion years. But interestingly, accounting for Albert Einstein’s minor adjustments (according to his theory of relativity), reduces the chances to just 1%. http://darwins-god.blogspot.com/2011/07/of-gaps-fine-tuning-and-newtons-solar.html Is the Solar System Stable? By Scott Tremaine – 2011 Excerpt: So what are the results? Most of the calculations agree that eight billion years from now, just before the Sun swallows the inner planets and incinerates the outer ones, all of the planets will still be in orbits very similar to their present ones. In this limited sense, the solar system is stable. However, a closer look at the orbit histories reveals that the story is more nuanced. After a few tens of millions of years, calculations using slightly different parameters (e.g., different planetary masses or initial positions within the small ranges allowed by current observations) or different numerical algorithms begin to diverge at an alarming rate. More precisely, the growth of small differences changes from linear to exponential:,,, As an example, shifting your pencil from one side of your desk to the other today could change the gravitational forces on Jupiter enough to shift its position from one side of the Sun to the other a billion years from now. The unpredictability of the solar system over very long times is of course ironic since this was the prototypical system that inspired Laplacian determinism. Fortunately, most of this unpredictability is in the orbital phases of the planets, not the shapes and sizes of their orbits, so the chaotic nature of the solar system does not normally lead to collisions between planets. However, the presence of chaos implies that we can only study the long-term fate of the solar system in a statistical sense, by launching in our computers an armada of solar systems with slightly different parameters at the present time—typically, each planet is shifted by a random amount of about a millimeter—and following their evolution. When this is done, it turns out that in about 1 percent of these systems, Mercury’s orbit becomes sufficiently eccentric so that it collides with Venus before the death of the Sun. Thus, the answer to the question of the stability of the solar system—more precisely, will all the planets survive until the death of the Sun—is neither “yes” nor “no” but “yes, with 99 percent probability.” https://www.ias.edu/about/publications/ias-letter/articles/2011-summer/solar-system-tremaine
bornagain77
A few inconvenient facts for our Atheistic chicken little global warming alarmists: First off Global warming is not unprecedented
Temperature of Earth for the last 10,000 years http://climate.geologist-1011.net/HoloceneTemperatures.png The evidence shows repeatedly that global warming is not unprecedented and according to Ruddiman (2001) as well as Singer & Avery (2006), global warming is a regular cyclic phenomenon on planet Earth. In fact, the normal global mean temperature for planet earth given the Phanerozoic history, is actually 19.5 degrees Celcius; a full three degrees higher than the present mean. http://climate.geologist-1011.net/ Temperature of earth last 5 million years: https://www.giss.nasa.gov/research/briefs/hansen_15/fig1.gif
Moreover, CO2 does not directly correlate to temperature
What They Haven't Told You about Climate Change – PragerU – video CO2 and Temperature have not directly correlated for millions of years. https://www.youtube.com/watch?v=RkdbSxyXftc Does CO2 correlate with temperature history? – A look at multiple timescales in the context of the Shakun et al. Paper - Anthony Watts / April 11, 2012 Excerpt: Only at greater time scales is there time for even seawater thousands of meters deep to fully warm and release more CO2.  Accordingly, only at greater “medium” time scales does CO2 and temperature correlate highly, as can be seen contrasting the 400,000-year graph to the 11,000-year graph. Evidence for how CO2 in ice core data lags temperature by centuries has been discussed before at Watts Up With That, including articles in 2009 by Frank Lansner and R. Taylor. A simple Henry’s Law formula is applicable to a glass of water on a table releasing more previously-dissolved gas when warmed, but it is not literally valid when there are chemical reactions with the solute (CO2). The oceans are a far more complex system in general.  However, still, more CO2 is released eventually when the planet warms.  The atmosphere and the ocean surface (or shallow zones) warms much first, then deeper waters later. https://wattsupwiththat.com/2012/04/11/does-co2-correlate-with-temperature-history-a-look-at-multiple-timescales-in-the-context-of-the-shakun-et-al-paper/ The Truth about CO2 – Patrick Moore – co-founder GreenPeace - video https://www.youtube.com/watch?v=WDWEjSDYfxc
Moreover, CO2 levels for optimal plant growth are actually much higher than they presently are
Human Emissions Saved Planet Excerpt: Over the past 150 million years, carbon dioxide had been drawn down steadily (by plants) from about 3,000 parts per million to about 280 parts per million before the Industrial Revolution. If this trend continued, the carbon dioxide level would have become too low to support life on Earth. Human fossil fuel use and clearing land for crops have boosted carbon dioxide from its lowest level in the history of the Earth back to 400 parts per million today. At 400 parts per million, all our food crops, forests, and natural ecosystems are still on a starvation diet for carbon dioxide. The optimum level of carbon dioxide for plant growth, given enough water and nutrients, is about 1,500 parts per million, nearly four times higher than today. Greenhouse growers inject carbon-dioxide to increase yields. Farms and forests will produce more if carbon-dioxide keeps rising. We have no proof increased carbon dioxide is responsible for the earth’s slight warming over the past 300 years. There has been no significant warming for 18 years while we have emitted 25 per cent of all the carbon dioxide ever emitted. Carbon dioxide is vital for life on Earth and plants would like more of it. Which should we emphasize to our children? https://uncommondescent.com/global-warming/greenpeace-founder-patrick-moore-on-global-warming/ Carbon Dioxide In Greenhouses Introduction The benefits of carbon dioxide supplementation on plant growth and production within the greenhouse environment have been well understood for many years. For the majority of greenhouse crops, net photosynthesis increases as CO2 levels increase from 340–1,000 ppm (parts per million). Most crops show that for any given level of photosynthetically active radiation (PAR), increasing the CO2level to 1,000 ppm will increase the photosynthesis by about 50% over ambient CO2 levels.  http://www.omafra.gov.on.ca/english/crops/facts/00-077.htm
bornagain77
From wikipedia:
The Keeling Curve also shows a cyclic variation of about 5 ppmv in each year corresponding to the seasonal change in uptake of CO2 by the world's land vegetation. Most of this vegetation is in the Northern hemisphere, since this is where most of the land is located. From a maximum in May, the level decreases during the northern spring and summer as new plant growth takes carbon dioxide out of the atmosphere through photosynthesis. After reaching a minimum in September, the level rises again in the northern fall and winter as plants and leaves die off and decay, releasing the gas back into the atmosphere.[15] The impact of green plankton material in the worlds oceans, which may actually be responsible for taking up to 60% of the carbon dioxide out of the atmosphere through photosynthesis is yet to be fathomed though.
I wonder what the "teachable" aspect to this is. Perhaps "CO2 is plant food"? daveS
As others have said, this is the result of Northern forests photosynthesising more during warmer months (and there being more land so more plants in the north). It's also partly about the rate at which co2 mixes in the atmosphere, the amplitude is larger the further north you go. Looking forward to the alternative explanation of this phenomenon... mullers_ratchet
My guess would be that the seasonal variation in atmospheric CO2 is correlated with Oceanic primary production in the area. Molson Bleu
I had assume that they were because most land mass is in the northern hemisphere, so the extra growth in the northern summer means that plants are taking CO2 out of the atmosphere. There are some nice animations of remotely sensed vegetation here (and the data can be downloaded too). Bob O'H
Aren't those cycles due to variation in plant consumption of CO2, which occurs mostly in the northern hemisphere? daveS
Hint: What do the oscillations mean? What are they telling us? PaV

Leave a Reply