Uncommon Descent Serving The Intelligent Design Community

The amazing level of engineering in the transition to the vertebrate proteome: a global analysis

Share
Facebook
Twitter
LinkedIn
Flipboard
Print
Email

As a follow-up to my previous post:

I am presenting here some results obtained by a general application, expanded to the whole human proteome, of the procedure already introduced in that post.

Main assumptions.

The aim of the procedure is to measure a well defined equivalent of functional information in proteins: the information that is conserved throughout long evolutionary times, in a well specified evolutionary line.

The simple assumption is that  such information, which is not modified by neutral variation in a time span of hundreds of million years, is certainly highly functionally constrained, and is therefore a very good empirical approximation of the value of functional information in a protein.

In particular, I will use the proteins in the human proteome as “probes” to measure the information that is conserved from different evolutionary timepoints.

The assumption here is very simple. Let’s say that the line that includes humans (let’s call it A) splits from some different line (let’s call it B) at some evolutionary timepoint T. Then, the homology that we observe in a protein when we compare organisms derived from B  and humans (derived from A) must have survived neutral variation throughout the timespan from T to now. If the timespan is long enough, we can very safely assume that the measured homology is a measure of some specific functional information conserved from the time of the split to now.

Procedure.

I downloaded a list of the basic human proteome (in FASTA form). In particular, I downloaded it from UNIPROT selecting all human reviewed sequences, for a total of 20171 sequences. That is a good approximation of the basic human  proteome as known at present.

I used NCBI’s blast tool in local form to blast the whole human proteome against known protein sequences from specific groups of organisms, using the nr (non redundant) NCBI database of protein sequences, and selecting, for each human protein, the alignment with the highest homology bitscore from that group of organisms.

Homology values:

I have used two different measures of homology for each protein alignment:

  1. The total bitscore from the BLAST alignment (from now on: “bits”)
  2. The ratio of the total bitscore to the length in aminoacids of the human protein, that I have called “bits per aminoacid” (from now on, “baa”). This is a measure of the mean “density” of functional information in that protein, which corrects for the protein length.

The values of homology in bits have a very wide range of variation  in each specific comparison with a group of organisms. For example, in the comparison between human proteins and the proteins in cartilaginous fish, the range of bit homology per protein is 21.6 – 34368, with a mean of 541.4 and a median of 376 bits.

The vlaues of homology in baa , instead, are necessarily confined between 0 and about 2.2. 2.2, indeed, is (approximately) the highest homology bitscore (per aminoacid) that we get when we blast a protein against itself (total identity).  I use the BLAST bitscore because it is a widely used and accepted way to measure homology and to derive probabilities from it (the E values).

So, for example, in the same human – cartilaginous fish comparison, the range of the baa values is:  0.012 – 2.126, with a mean of 0.95 and a median of 0.97 baas.

For each comparison, a small number of proteins (usually about 1-2%) did not result in any significant alignment, and were not included in the specific analysis for that comparison.

Organism categories and split times:

The analysis includes the following groups of organisms:

  • Cnidaria
  • Cephalopoda (as a representative sample of Mollusca, and more in general Protostomia: cephalopoda and more generally Mollusca, are, among Protostomia, a group with highest homology to deuterostomia, and therefore can be a good sample to evaluate conservation from the protostomia – deuterostomia split).
  • Deuterostomia (excluding vertebrates): this includes echinoderms, hemichordates and chordates (excluding vertebrates).
  • Cartilaginous fish
  • Bony fish
  • Amphibians
  • Crocodylia, including crocodiles and alligators (as a representative sample of reptiles, excluding birds. Here again, crocodylia have usually the highest homology with human proteins among reptiles, together maybe with turtles).
  • Marsupials (an infraclass of mammals representing Metatheria, a clade which split early enough from the human lineage)
  • Afrotheria, including elephants and other groups (representing a group of mammals relatively distant from the human lineage, in the Eutheria clade)

There are reasons for these choices, but I will not discuss them in detail for the moment. The main purpose is always to detect the functional information (in form of homology) that was present at specific split times, and has been therefore conserved in both lines after the split. In a couple of cases (Protostomia, Reptiles), I have used a smaller group (Cephalopoda, Crocodylia) which could reasonably represent the wider group, because using very big groups of sequences (like all protostomia, for example) was too time consuming for my resources.

So what are the split times we are considering? This is a very difficult question, because split times are not well known, and very often you can get very different values for them from different sources. Moreover, I am not at all an expert of these issues.

So, the best I can do is to give here some reasonable proposal, from what I have found, but I am completely open to any suggestions to improve my judgements. In each split, humans derive from the second line:

  • Cnidaria – Bilateria. Let’s say at least 555 My ago.
  • Protostomia – deuterostomia.  Let’s say about 530 My ago.
  • Pre-vertebrate deuterostomia (including chordates like cephalocordata and Tunicates) – Vertebrates  (Cartilaginous fish). Let’s say 440 My ago.
  • Cartilaginous fish – Bony fish. Let’s say about 410 My ago.
  • Bony fish – Tetrapods (Amphibians). Let’s say 370 My ago, more or less.
  • Amphibians – Amniota (Sauropsida, Crocodylia): about 340 My ago
  • Sauropsida (Crocodylia) – Synapsida (Metatheria, Marsupialia): about 310 My ago
  • Metatheria – Eutheria (Afrotheria): about 150 My ago
  • Atlantogenata (Afrotheria) – Boreoeutheria: probably about 100 My ago.

The simple rule is: for each split, the second member of each split is the line to humans, and the human conserved information present in the first member of each couple must have been conserved in both lines at least from the time of the split to present day.

So, for example, the human-conserved information in Cnidaria has been conserved for at least 555 MY, the human-conserved information in Crocodylia has been conserved for at least 310 My, and so on.

The problem of redundancy (repeated information).

However, there is an important problem that requires attention. Not all the information in the human proteome is unique, in the sense of “present only once”. Many sequences, especially domains, are repeated many times, in more or less similar way, in many different proteins. Let’s call this “the problem of redundancy”.

So, all the results that we obtain about homologies of the human proteome to some other organism or group of organisms should be corrected for that factor, if we want to draw conclusions about the real amount of new functional information in a transition. Of course, repeated information will inflate the apparent amount of new functional information.

Therefore, I computed a “coefficient of correction for redundancy” for each protein in the human proteome. For the moment, for the sake of simplicity, I will not go into the details of that computation, but I am ready to discuss it in depth if anyone is interested.

The interesting result is that the mean coefficient of correction is, according to my computations, 0.497. IOWs, we can say that about half of the potential information present in the human proteome can be considered unique, while about half can be considered as repeated information. This correction takes into account, for each protein in the human proteome, the number of proteins in the human proteome that have significant homologies to that protein and their mean homology.

So, when I give the results “corrected for redundancy” what I mean is that the homology values for each protein have been corrected multiplying them for the coefficient of that specific protein. Of course, in general, the results will be approximately halved.

Results

Table 1 shows the means of the values of total homology (bitscore) with human proteins in bits and in bits per aminoacid for the various groups of organisms.


Group of organisms Homology bitscore

(mean)

Total homology

bitscore

Bits per aminoacid

(mean)

Cnidaria 276.9 5465491 0.543
Cephalopoda 275.6 5324040 0.530
Deuterostomia (non vertebrates) 357.6 7041769 0.671
Cartilaginous fish 541.4 10773387 0.949
Bony fish 601.5 11853443 1.064
Amphibians 630.4 12479403 1.107
Crocodylia 706.2 13910052 1.217
Marsupialia 777.5 15515530 1.354
Afrotheria 936.2 18751656 1.629
Maximum possible value (for identity) 24905793 2.2


Figure 1 shows a plot of the mean bits-per-aminoacid score in the various groups of organisms, according to the mentioned approximate times of split.

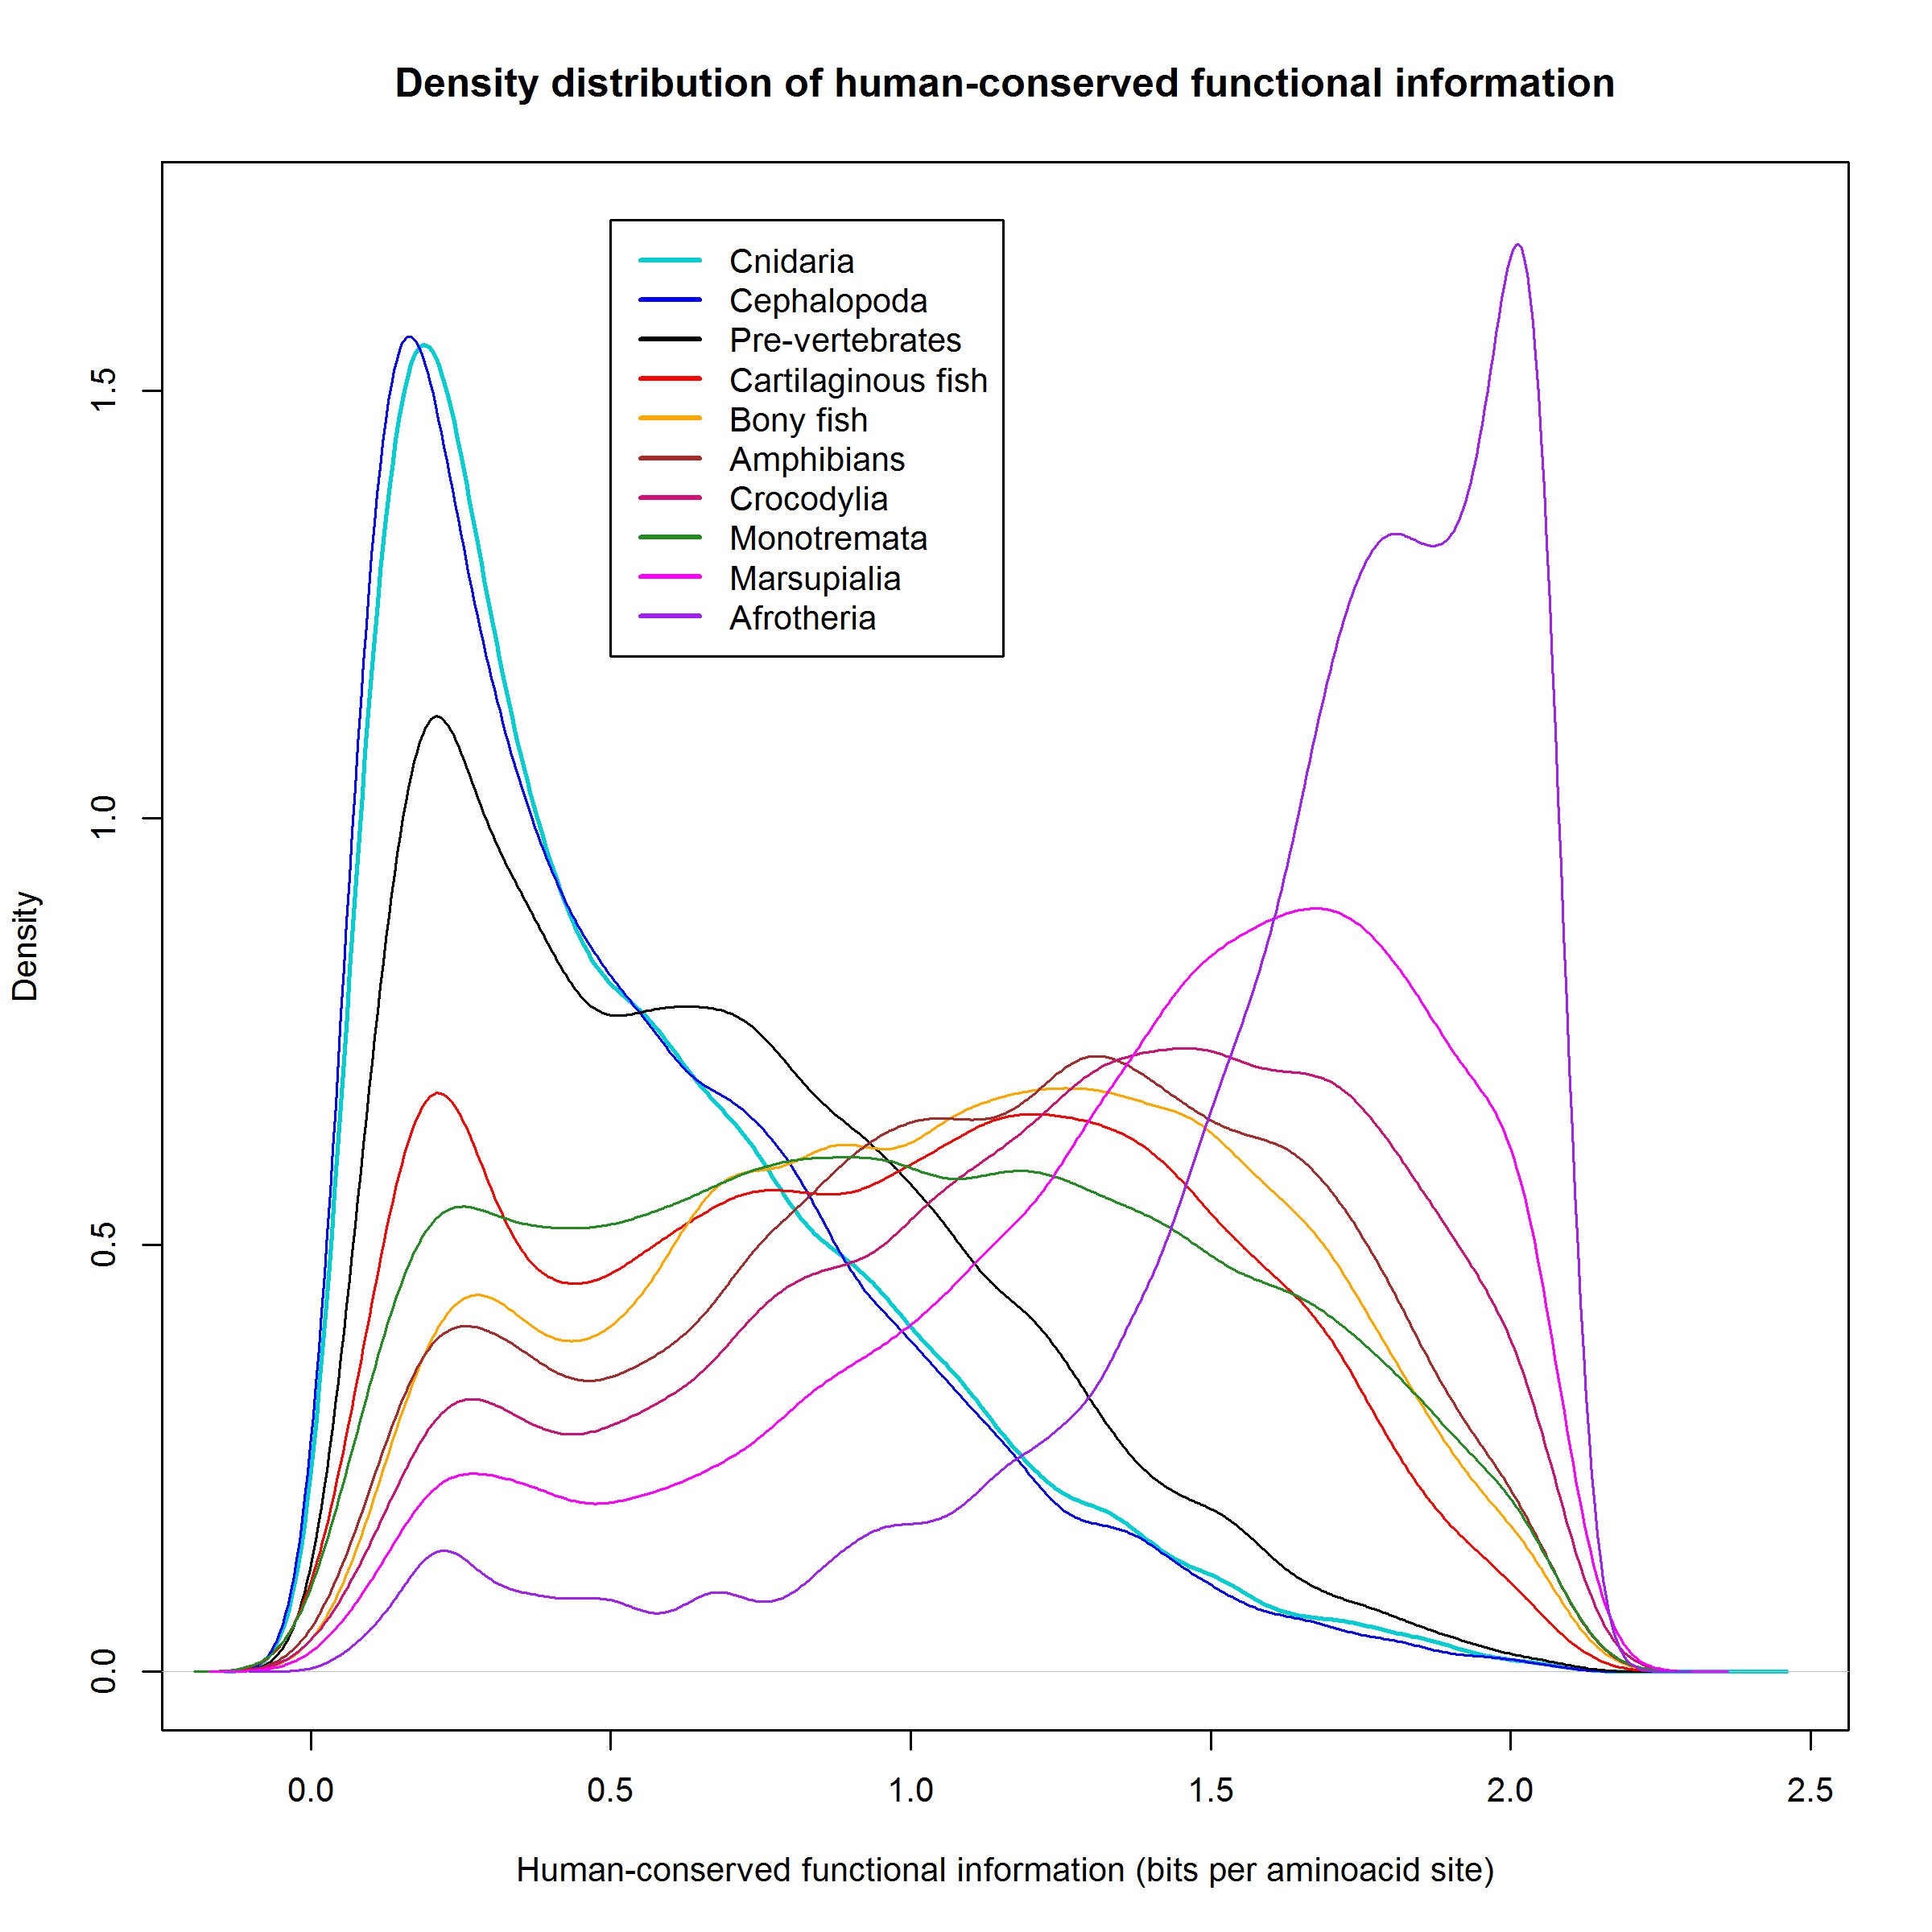
Figure 2 shows a plot of the density distribution of human-conserved functional information in the various groups of organisms.


The jump to vertebrates.

Now, let’s see how big are the informational jumps for each split, always in relation to human conserved information.

The following table sums up the size of each jump:


Split Homology bitscore jump (mean) Total homology bitscore jump Bits per aminoacid (mean)
Homology bits in Cnidaria 5465491 0.54
Cnidaria – Bilateria (cephalopoda) -6.3 -121252 -0.02
Protostomia (Cephalopoda)- Deuterostomia 87.9 1685550 0.15
Deuterostomia (non vert.) – Vertebrates (Cartilaginous fish) 189.6 3708977 0.29
Cartilaginous fish-Bony fish 54.9 1073964 0.11
Bony fish-Tetrapoda (Amphibians) 31.9 624344 0.05
Amphibians-Amniota (Crocodylia) 73.3 1430963 0.11
Sauropsida (Crocodylia)-Synapsida (Marsupialia) 80.8 1585361 0.15
Metatheria (Marsupialia) – Eutheria (Afrotheria) 162.2 3226932 0.28
Total bits of homology in Afrotheria 18751656 1.63
Total bits of maximum information in  humans 24905793 2.20


The same jumps are shown graphically in Figure 3:


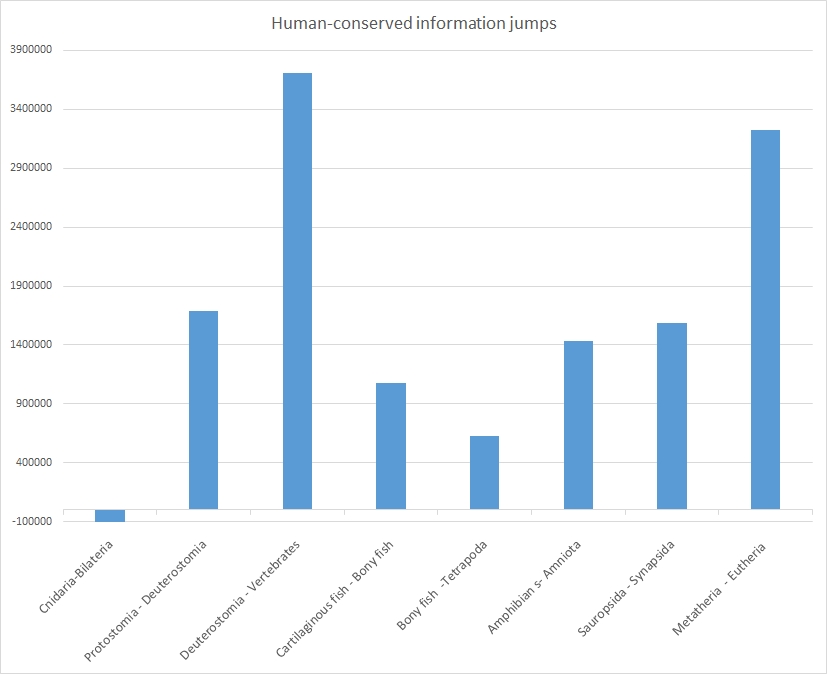
As everyone can see, each of these splits, except the first one (Cnidaria-Bilateria) is characterized by a very relevant informational jumps in terms of human-conserved information. The split is in general of the order of 0.5 – 1.5 million bits.

However, two splits are characterized by a much bigger jump: the prevertebrate-vertebrate split reaches 3.7 million bits, while the Methateria-Eutheria split is very near, with 3.2 million bits.

For the moment I will discuss only the prevertebrate-vertebrate jump.

This is where a great part of the functional information present in humans seems to have been generated: 3.7 million bits, and about 0.29 bits per aminoacid of new functional information.

Let’s see that jump also in terms of information density, looking again at Figure 2, but only with the first 4 groups of organisms:


Where is the jump here?


We can see that the density distribution is almost identical for Cnidaria and Cephalopoda. Deuterostomia (non vertebrates) have a definite gain in human-conserved information, as we know, it is about 1.68 million bits, and it corresponds to the grey area (and, obviously, to the lower peak of low-homology proteins).

But the real big jump is in vertebrates (cartilaginous fish). The pink area and the lower peak in the low homology zone correspond to the amazing acquisition of about 3.7 million bits of human-conserved functional information.

That means that a significant percentage of proteins in cartilaginous fish had a high homology, higher than 1 bit per aminoacid, with the corresponding human protein. Indeed, that is true for 9574 proteins out of 19898, 48.12% of the proteome. For comparison, these high homology proteins are “only” 4459 out of 19689,  22.65% of the proteome in pre-vertebrates.

So, in the transition from pre-vertebrates to vertebrates, the following amazing events took place:

  • About 3,7 million bits of human-conserved functional information were generated
  • A mean increase of about 190 bits per proteins of that information took place
  • The number of high human homology proteins more than doubled

Correcting for redundancy

However, we must still correct for redundancy if we want to know how much really new functional information was generated in the transition to vertebrates. As I have explained, we should expect that about half of the total information can be considered unique information.

Making the correction for each single protein, the final result is that the total number of new unique functional bits that appear for the first time in the transition to vertebrates, and are then conserved up to humans, is:

1,764,427  bits

IOWs, more than 1.7 million bits of unique new human-conserved functional information are generated in the proteome with the transition to vertebrates.

But what does 1.7 million bits really mean?

I would like to remind that we are dealing with exponential values here. A functional complexity of 1.7 million bits means a probability (in a random search) of:

1:2^1.7 million

A quite amazing number indeed!

Just remember that Dembski’s Universal Probability Bound is 500 bits, a complexity of 2^500. Our number (2^1764427) is so much bigger that the UPB seems almost a joke, in comparison.

Moreover, this huge modification in the proteome seems to be strongly constrained and definitely necessary for the new vertebrate bodily system, so much so that it is conserved for hundreds of millions of years after its appearance.

Well, that is enough for the moment. The analysis tools I have presented here can be used for many other interesting purposes, for example to compare the evolutionary history of proteins or groups of proteins. But that will probably be the object of further posts.

Comments
A lot of work obviously went into this. Have you though about drafting this as a research paper and submitting it to a peer reviewed paper?Armand Jacks
March 23, 2017
March
03
Mar
23
23
2017
12:39 PM
12
12
39
PM
PDT
Do you have any evidence of the structure and function of the proteins present at the time that these ancient lifeforms existed? And any evidence to support the contention that the divergence of those lifeforms could not have occurred by evolutionary processes? Certainly the analysis of modern proteins might give us some insight into what may have existed at the time, but to try to derive a likelihood measure from the modern proteosome is, well, "zombie science".timothya
March 23, 2017
March
03
Mar
23
23
2017
12:38 PM
12
12
38
PM
PDT
timothya: Uff! Chordata not vertebrates are cephalochordata and urochordata.gpuccio
March 23, 2017
March
03
Mar
23
23
2017
11:51 AM
11
11
51
AM
PDT
Gpuccio: "a) Deuterostomia not vertebrates. As you can read in the OP, this group: “includes echinoderms, hemichordates and chordates (excluding vertebrates).” b) Vertebrates, in particular cartilaginous fish." Still incoherent. Vertebrates are chordates. How can they be excluded? From Wikipedia: "There are three major clades of deuterostomes: Chordata (vertebrates and their kin) Echinodermata (starfish, sea urchins, sea cucumbers, etc.) Hemichordata (acorn worms and graptolites)"timothya
March 23, 2017
March
03
Mar
23
23
2017
11:49 AM
11
11
49
AM
PDT
KF: Done! :)gpuccio
March 23, 2017
March
03
Mar
23
23
2017
11:49 AM
11
11
49
AM
PDT
GP, I suggest linking that earlier post in the first line of this one. KFkairosfocus
March 23, 2017
March
03
Mar
23
23
2017
11:44 AM
11
11
44
AM
PDT
timothya: "This is incoherent. Vertebrates are deuterostomes. What are you talking about?" What's the problem with you? a) Deuterostomia not vertebrates. As you can read in the OP, this group: "includes echinoderms, hemichordates and chordates (excluding vertebrates)." b) Vertebrates, in particular cartilaginous fish. Those are the two lineages considered in evaluating the transition to the vertebrate proteome, and the relative information jump. Vertebrates are deuterostome, but not all deuterostome are vertebrates. Is it clear now?gpuccio
March 23, 2017
March
03
Mar
23
23
2017
11:34 AM
11
11
34
AM
PDT
Bill Cole: From reading your work and Kirk’s paper I still wonder if looking at historic sequences will give us a reliable measure of functional information.
To be clear, Bill. Do you envision any wiggle room for Darwinists to not accept GPuccio's assumption?
GPuccio: The simple assumption is that such information, which is not modified by neutral variation in a time span of hundreds of million years, is certainly highly functionally constrained, and is therefore a very good empirical approximation of the value of functional information in a protein.
Origenes
March 23, 2017
March
03
Mar
23
23
2017
11:30 AM
11
11
30
AM
PDT
Gpuccio: "The point of the article is that it tries to quantify how much new functional information is present in vertebrates at the start of their evolutionary history, compared to what was present immediately before (deuterostomia not vertebrates)." This is incoherent. Vertebrates are deuterostomes. What are you talking about?timothya
March 23, 2017
March
03
Mar
23
23
2017
11:27 AM
11
11
27
AM
PDT
bill cole: "The simulation they are doing is essentially meaningless." I agree. Except for the meaning of propaganda.gpuccio
March 23, 2017
March
03
Mar
23
23
2017
11:22 AM
11
11
22
AM
PDT
gpuccio
Finally, Figure 5 is really irritating. Again a simulation, and again evidence of how cognitive bias can generate false and artificial reasoning. In brief, they define a low level of “function” (artificially), then they “evolve” it artificially by mutation and artificial selection, and, surprise surprise, they get high function (always artificially defined). OK, and so? The peral is that they use tis simulation to affirm that the detection of high functional information in the high function group overestimates the true FI, because the low function group exists! This is not even reasoning.
This is where they describe FI or functional information as MISA. The reason the information is defined as functional is because the sequence comes from a living organism. Once they change the sequence in any way without a biological experiment to verify function all bets are off. The simulation they are doing is essentially meaningless.bill cole
March 23, 2017
March
03
Mar
23
23
2017
11:18 AM
11
11
18
AM
PDT
Phinehas: "You could hear a pin drop." Correct. But, as you can see, we are trying to make some noise, even by a small amount of provocation. Let's see what happens...gpuccio
March 23, 2017
March
03
Mar
23
23
2017
11:18 AM
11
11
18
AM
PDT
bill cole: "From reading your work and Kirk’s paper I still wonder if looking at historic sequences will give us a reliable measure of functional information. I would appreciate your thoughts on this and how you see a path to improving the accuracy of our measurements." My thoughts are simple: yes, it will. What we already know about proteomes is more than enough to give a reliable general scenario. If we really want to look at it. But there is no doubt that the rapidly evolving knowledge about genomes, proteomes, protein functional space, epigenetics and so on will constantly improve our understanding. My absolute certainty is that each advancement in each of these fields will only make the evidence for design, if possible, even greater. And most people will go on ignoring that evidence. That's how cognitive bias works, especially if established at such a universal level. You say: "In all fairness to Dr Swamidass he introduced his paper as only preliminary thinking." OK, that's fine for me. Let's say it is bad preliminary thinking. Well, he may have some minor points partially right about the Durston methodology, but he has made no attempt to correct it and verify the results. He is ideologically motivated, and looks for any possible way to deny the value of functional information in biology. That cannot be accepted, IMO.gpuccio
March 23, 2017
March
03
Mar
23
23
2017
11:16 AM
11
11
16
AM
PDT
timothya: Old "objection". Biological evolution (according to darwinists) does proceed by random variation and NS. RV is a random search. The role of NS is easily shown as completely helpless, if the RV part (the random search) cannot generate the bits of functional information that confer the function. The point of the article is that it tries to quantify how much new functional information is present in vertebrates at the start of their evolutionary history, compared to what was present immediately before (deuterostomia not vertebrates). IOWs, a massive information jump. If you think that you can easily explain that jump by RV and NS, I am happy for you. I beg to think differently. However, I think that trying to quantify these things should be of interest to anyone involved in the discussion.gpuccio
March 23, 2017
March
03
Mar
23
23
2017
11:09 AM
11
11
09
AM
PDT
UB: Then there is this pearl:
This rationale, however, is flawed because evolution does not sample sequences with uniform likelihood. If we accept the definition of FI presented in Equation 1, FI just tells us the proportion of sequences that are functional. If evolution just sampled uniformly from the space of all proteins, it is possible that FI would be a good estimate of evolvability. However, evolution proceeds by sampling around existing protein and DNA sequences, which are substantially enriched for function.
What does he mean? That functional sequences are confined to a restricted sequence space? This is folly! What abou the completely separated 2000+ protein superfamilies? And again:
Evolvability is better estimated by measuring the distance between existing sequences and the closest family of functional proteins. FI, however, tells us nothing about how close the first functional protein of a family was to preexisting sequences without that function
So, who will tell us something about "how close the first functional protein of a family was to preexisting sequences without that function"? A big problem, to which Axe and others have dedicated years of hard work. But no, the answer is simpler: it's enough to look at Figure 4, well designed by the authors themselves, and all doubts can be solved! We have one strong hint that new functions are close to old functions and abundant, and therefore easy to evolve. One strong hint? The same protein family can often perform several different functions. If functionality were astronomically rare and isolated in sequence space, this would be nearly impossible. Why? Please note that they are strangely receding at the family level. What about superfamilies? No mention of them, of course. But families are groups of proteins that already have great similarity in structure, very often in sequence, and usually also in function. Because function can often be modular. One first step to function is some type of folding. The same folding can support different structures (superfamilies). Proteins in the same family share a lot of functional information already. Still, their final function can be significantly different. For example, it is sometimes enough to modify slightly the active site to change affinity for substrates. But again, we are speaking of tweaking at the level of the active site, when the folding and gross structure of the protein are already of a certain kind. No one denies that there are similar proteins that, by a change of 2-5 AAs, can have a different function. Axe has shown that even those small "transitions" are not so easy as one could expect. But anyway, that has nothing to do with the appearance of big bulks of functional information, like in the appearance of a new superfamily, or a new protein. Finally, Figure 5 is really irritating. Again a simulation, and again evidence of how cognitive bias can generate false and artificial reasoning. In brief, they define a low level of "function" (artificially), then they "evolve" it artificially by mutation and artificial selection, and, surprise surprise, they get high function (always artificially defined). OK, and so? The pearl is that they use this simulation to affirm that the detection of high functional information in the high function group overestimates the true FI, because the low function group exists! This is not even reasoning. Of course, what they define "low function" and what they define "high function" are two very different things. Of course, when we define a function, we must also define its minimum level. Of course, the artificial "simulation" has only the hidden purpose to convince the readers that what they do purposefully (artificially evolve what they want to evolve) is a model of what happens in nature. But that is not true at all. Where is the rich landscape of low functions, intermediate functions, and so on, all of them connected at sequence level, that allows the generation of the high function optimized wildtypes that we observe in existing proteomes? The answer is easy: except in the imagination and false simulations of darwinist fans, they are nowhere to be seen. Oh, but of course all the evidence has been "eaten" by the magic of NS! Oh, my goodness!gpuccio
March 23, 2017
March
03
Mar
23
23
2017
11:02 AM
11
11
02
AM
PDT
Gpuccio: "I would like to remind that we are dealing with exponential values here. A functional complexity of 1.7 million bits means a probability (in a random search) of: 1:2^1.7 million A quite amazing number indeed!" Biological evolution does not proceed by a "random search". So what, exactly, is the point of this article?timothya
March 23, 2017
March
03
Mar
23
23
2017
10:53 AM
10
10
53
AM
PDT
gpuccio
However, as I said, it is not my task to defend Durston from Swamidass’criticism. I would only suggest that he makes no attempt to correct Durston’s “errors”, trying to give an alternative reading of functional information, for example excluding sequences that are evolutionary too near. No, like all defenders of darwinism, he is only interested in denying the relevance of the concept of functional information, and so he is happy to criticize a methodology without offering any alternative.
First, thank you for the very interesting analysis. I had several discussions with Dr Swamisass at TSZ. I think the mistake he made in his initial analysis was that he had a different interpretation of MISA that Kirk did. In the case of Kirk MISA was simply information obtained from sequence comparison of genes from different species. Dr Swamidass"s experiment changed the observed sequences and therefore changed MISA away from Kirks definition. In all fairness to Dr Swamidass he introduced his paper as only preliminary thinking. From reading your work and Kirk's paper I still wonder if looking at historic sequences will give us a reliable measure of functional information. I would appreciate your thoughts on this and how you see a path to improving the accuracy of our measurements.bill cole
March 23, 2017
March
03
Mar
23
23
2017
10:47 AM
10
10
47
AM
PDT
UB: Another abused and ambiguous argument is that existing proteins are highly optimized. This is really strange, because I think it is really an argument for their high functional information. Again, the Hayashi experiment teaches us a lot of things. Not only the wildtype is optimized, but it is so optimized that it is impossible to find it from other functional islands. Darwinists like to think of optimization as the result of gradual natural selection in a connected landscape. But that is simply false, and no real examples of complex optimization, implying more than one or two AAs, really exist. the truth is that optimization means that we have proteins that represent extremely rare functional islands, and that the existence of those optimized sequences can only be explained by design. Moreover, gradual optimization is so often blindly invoked, but as soon as you ask where are the evidences of that gradual optimization, especially in terms of surviving intermediate, the magic of a completely efficient NS that has erased any trace of the process is immediately invoke. By the same people that are ready to invoke errors and scarcely efficient proteins in nature as evidence of the same process.gpuccio
March 23, 2017
March
03
Mar
23
23
2017
10:32 AM
10
10
32
AM
PDT
You could hear a pin drop. Quick, someone make a theological comment so the usual interlocutors won't be so intimidated by the scientific content in this thread! :PPhinehas
March 23, 2017
March
03
Mar
23
23
2017
10:30 AM
10
10
30
AM
PDT
UB: Again on that paper. Supplementary arguments are dedicated to explain how natural mutations would give higher permanence of residual homology. Maybe. However, the reasoning remains similar, and only limited events, IOWs limited evolutionary separation, allows the permanence of relevant detectable homology, in the absence of functional constraints. Many of these problems are drastically solved if we use the blast bitscore, as I have done, instead of a full bitscore. The blast algorithm already reduces many of those factors of possible false homology. That's why it is significantly lower than a full homology bitscore. Then there is the old argument of different proteins sharing the same function, which is often used to support the myth of an extremely rich and dense functional space. Now, we know that similar functions can be implemented by proteins with scarce sequence similarity and structure similarity. But: 1) This is certainly not the general case 2) There is no evidence that similar function means the same function. One of the errors of darwinian thought is to trivialize function, and not recognized that similar functions can really be very different in different contexts. As I have always said, many sequence difference can and certainly have functional value. When we assimilate all the differences to neutral variation, we definitely overestimate non functionality, and underestimate functional information. Moreover, we know from experiments like the rugged landscape study (Hayashi) that similar functional results, but with very different levels of functionality, can be found in different functional islands of the proteins landscape, each of them practically isolated from the others, so much so that in that famous experiment there was no realistic chance to find the island of the wildtype function by mutation and natural selection. IOWs, the existence of different islands that, in different ways and with different efficiency, can implement a similar (but probably not the same) function is evidence against the connected nature of the protein space: not only different functions are isolated islands in the landscape, as demonstrated by the 2000+ protein superfamilies for which no connection of sequence, structure or function can be found; but even similar functions can be implemented by isolated islands of sequence, without any realistic chance of traversing from one to the other.gpuccio
March 23, 2017
March
03
Mar
23
23
2017
10:22 AM
10
10
22
AM
PDT
UB: Now, some other thoughts about Swamidass'paper. Figure 2 shows how, given a certain dendity of homology in bits per aminoacid, the total homology scales linearly with sequence length. What a surprise, indeed. We are beyond the trivial here. Again, we are dealing with the basic simulation. Again, the homology found is only passive homology, and it is really significant only with less than one event (corresponding to 30 million years separation) and, obviously, long sequences. Now, it seems really obvious that if they start form a common ancestor, and then make only limited substitutions, they will still find some passive homology. Again, what a surprise! Their point seems to be that in Durston's methodology some component of sequences that are evolutionary too near can overestimate the evaluation of functional complexity, passing passive homology for functional constraints. Well, maybe. As I have explained, that has no relevance at all with my personal methodology, where big evolutionary separation ensures that such an effect cannot be present. However, if I wanted to defend Durston (that, after all, is not my task) I would say that I can think of many other factors that can cause an underestimate of functional information in his methodology. For example, considering all sequences labeled with some function in very different species will certainly generate great informational noise, and underestimate the true functional constraints, because many of those sequences can have functional differences that tweak the function in each specific context, and with Durston's methodology all such differences will simply falsely increase the estimate of the non functional part of the sequence. However, as I said, it is not my task to defend Durston from Swamidass'criticism. I would only suggest that he makes no attempt to correct Durston's "errors", trying to give an alternative reading of functional information, for example excluding sequences that are evolutionary too near. No, like all defenders of darwinism, he is only interested in denying the relevance of the concept of functional information, and so he is happy to criticize a methodology without offering any alternative. As already said, however, my methodology takes well into account the problem of passive homology, and is designed to avoid that problem just from the beginning.gpuccio
March 23, 2017
March
03
Mar
23
23
2017
10:03 AM
10
10
03
AM
PDT
Dionisio: "Since the author of the current thread is Italian, could this be a case of conflict of interests?" Oh! That could really give me a problem with peer review! :)gpuccio
March 23, 2017
March
03
Mar
23
23
2017
02:08 AM
2
02
08
AM
PDT
gpuccio @7:
I think I should thank prof. Swamidass for the kind (but completely unintentional) support!
Does that mean that professor S agrees on "The amazing level of engineering in the transition to the vertebrate proteome"? Cool! The guy finally got it! :) BTW, let's keep in mind what gpuccio wrote @2:
[...] this analysis is only about the proteome, and does not consider the non coding DNA, even the most obvious functional parts of it, like promoterome and enhancerome, and all the rest, and epigenetics, and so on…
Now, off topic, here's a funny thing I noticed the spell checker suggested as replacements for the terms promoterome and enhancerome: (1) promote Rome (2) enhance Rome Since the author of the current thread is Italian, could this be a case of conflict of interests? :) He pretends to write a scientific article but really wants to enhance and promote Rome! :)Dionisio
March 22, 2017
March
03
Mar
22
22
2017
10:58 PM
10
10
58
PM
PDT
This is why we ask questions!! Thanks GP(!) -- much to think about.Upright BiPed
March 22, 2017
March
03
Mar
22
22
2017
09:55 PM
9
09
55
PM
PDT
UB: Just gave a first look at the paper, which seems targeted to criticize the Durston paper (a little late on that, I would say! :) ) I will comment better on it tomorrow, but just look at Figure 1, which is about the results of their simulation, which is central to the thesis of the paper. I quote from the paper:
The mutation rates in the simulation correspond to very long time periods. One mutation per amino acid corresponds to more than 30 million years of mammalian evolution (at approximately ten mutations per base per billion years).
Emphasis mine. Well, in their simulation 30 million years reduce the observed homology to about 0.8 baa. We should also note that the unit of measure they are using is Durston's, which ranges from 0 to 4.5 bits, and corresponds to the total informational potential of a sequence. The unit of measure I used here is derived from the BLAST bitscore, which ranges from 0 to about 2.2 baa. That about half of the full informational potential of a sequence, and that's because the blast algorithm computes the bitscore by making important adjustments, so that it better corresponds to the probability of observing the alignment, given the conditions of the comparison. That means that 30 million years, using the blast bitscore, would reduce any homology to about 0.4 baa. In my analysis of vertebrates, I find a mean homology (from the bitscore) of 0.9491001 baa (median 0.9685318, range 0.01232162 - 2.12605) between cartilaginous fish and humans, with an evolutionary separation of about 410 million years! According to Swamidass' simulation, how much should it be, after 410 million years of neutral evolution? Swamidass gives the answer himself:
MISA does go to zero if the mutation rate is increased to several events per amino acid, as the memory of the ancestral sequence is wiped. So, in addition to the effect of functional constraints, MISA encodes the mutational age of the protein family.
(MISA = mutual information of a sequence alignment, in the Swamidass paper) Correct. So, if one mutational event per aminoacid reduces the observed homology, in his simulation, to 0.8 baa (corresponding to 0.4 baa in bitscore units), we can be sure that 410 million years of evolution, more than ten times that evolutionary distance, will correspond to more than 10 events per aminoacid, and completely erase any passive homology due to derivation from a common ancestor. IOWs, all the homology observed between distant evolutionary lines can be traced to high functional constraints. Which is exactly my point here. Another demonstration of the same principle is that 300 - 400 million years of neutral evolution are usually more than enough to erase any detectable homology in the synonymous sites of a protein coding gene, as I have argued many times in my past posts. Of course, if we look at shorter evolutionary separations, the effects of passive homology must be taken in consideration. That's why I have focused here on the transition to vertebrates, which guarantees a long and safe evolutionary separation between the two lines. And, as you can easily see, My general reasonings and data presented here stop at about 100 million years of evolutionary separation, which should anyway ensure that most, maybe not all, of the observed homology is due to functional constraints. If I had discussed the information jump in mammals, for example, I would have mentioned this point, as I will certainly do when I treat that other aspect of my data. I think I should thank prof. Swamidass for the kind (but completely unintentional) support! :)gpuccio
March 22, 2017
March
03
Mar
22
22
2017
09:11 PM
9
09
11
PM
PDT
UB: Thank you. I will have a look at the paper you quote, and let you know. (By the means, I have also looked at the other paper you referenced in the other thread, but have not yet had the time to comment on it. I will do that as soon as possible! :) ) Thank you again!gpuccio
March 22, 2017
March
03
Mar
22
22
2017
08:23 PM
8
08
23
PM
PDT
Hi GP, Congratulations on another excellent paper. I expect you may get caught up in cross-platform comments with TSZ, as you did in your last paper. If and when time permits, I'd be interested in knowing how you see your paper compare and contrast with Swamidass's recent paper. Perhaps a comparison doesn't bear any fruit, but I thought I'd ask. Again, congrats.Upright BiPed
March 22, 2017
March
03
Mar
22
22
2017
05:41 PM
5
05
41
PM
PDT
Dionisio: You are welcome! :)gpuccio
March 22, 2017
March
03
Mar
22
22
2017
02:26 PM
2
02
26
PM
PDT
Glad to see a new article by gpuccio here!!! As usual, very insightful, well researched and solidly documented. Definitely it provides much food for thoughts. I may have a few questions after I read it carefully.
Our number (2^1764427) is so much bigger that the UPB seems almost a joke, in comparison.
This is serious stuff indeed.Dionisio
March 22, 2017
March
03
Mar
22
22
2017
02:09 PM
2
02
09
PM
PDT
Origenes: Thank you for the comment. Yes, of course this analysis is only about the proteome, and does not consider the non coding DNA, even the most obvious functional parts of it, like promoterome and enhancerome, and all the rest, and epigenetics, and so on...gpuccio
March 22, 2017
March
03
Mar
22
22
2017
01:30 PM
1
01
30
PM
PDT
1 6 7 8 9

Leave a Reply